Plot time series stacked bar chart
plot_ts_stacked_bar.RdPlot time series stacked bar chart
Arguments
- data
A data frame
- varname
Variable to plot
- time
Time variable
- style
Add minimal theme and ggsci palette
Value
A list contains:
* `data`: A tibble created by `calc_ts_np()`
* `plot`: A ggplot object for the time series stacked bar chart
Author
Thinh Ong https://github.com/thinhong
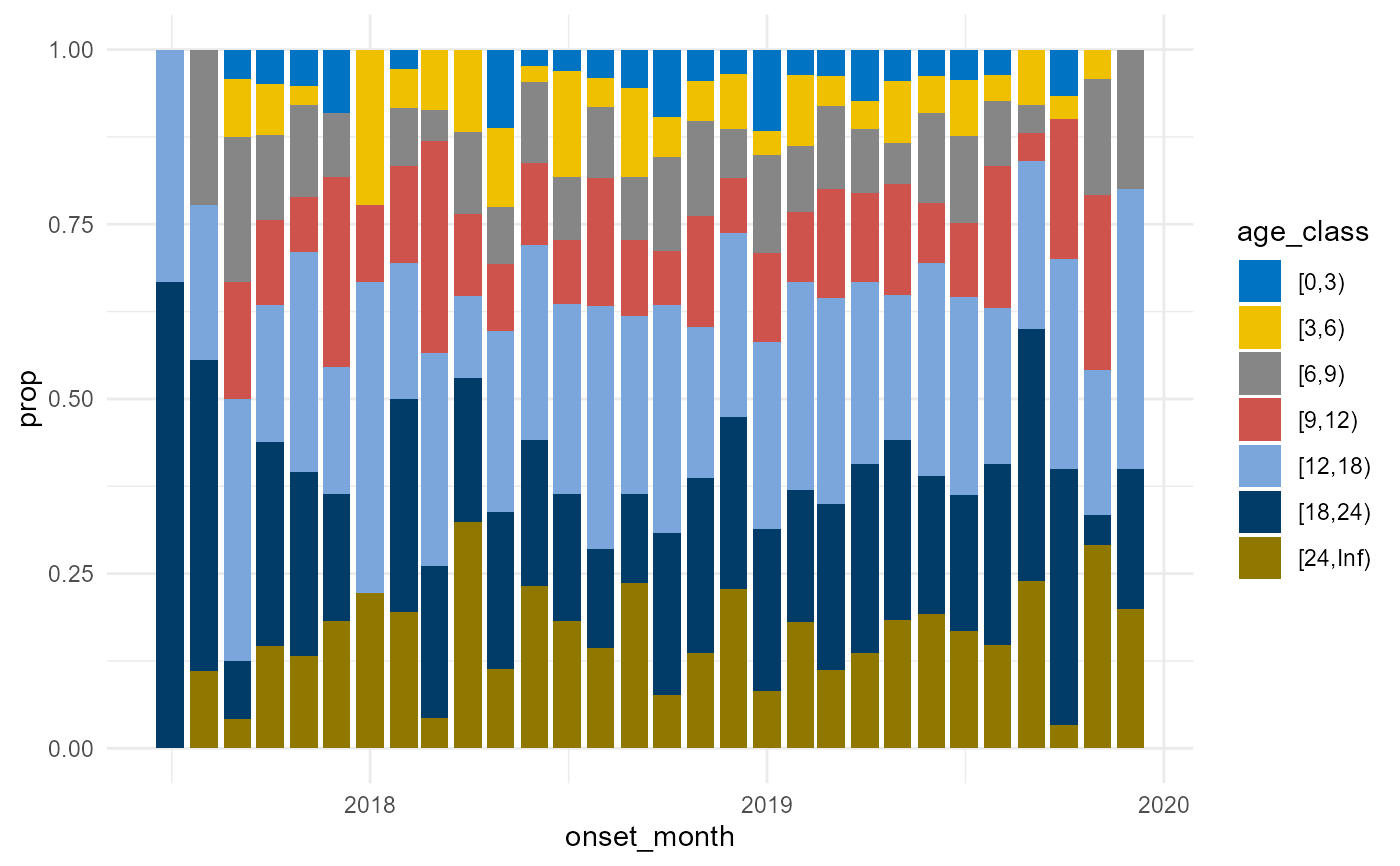
Examples
df <- patients
outp <- plot_ts_stacked_bar(data = df, varname = age_class, time = onset_month)
outp$plot

# Add other ggplot elements
outp$plot + ggsci::scale_fill_jco() + ggplot2::theme_minimal()
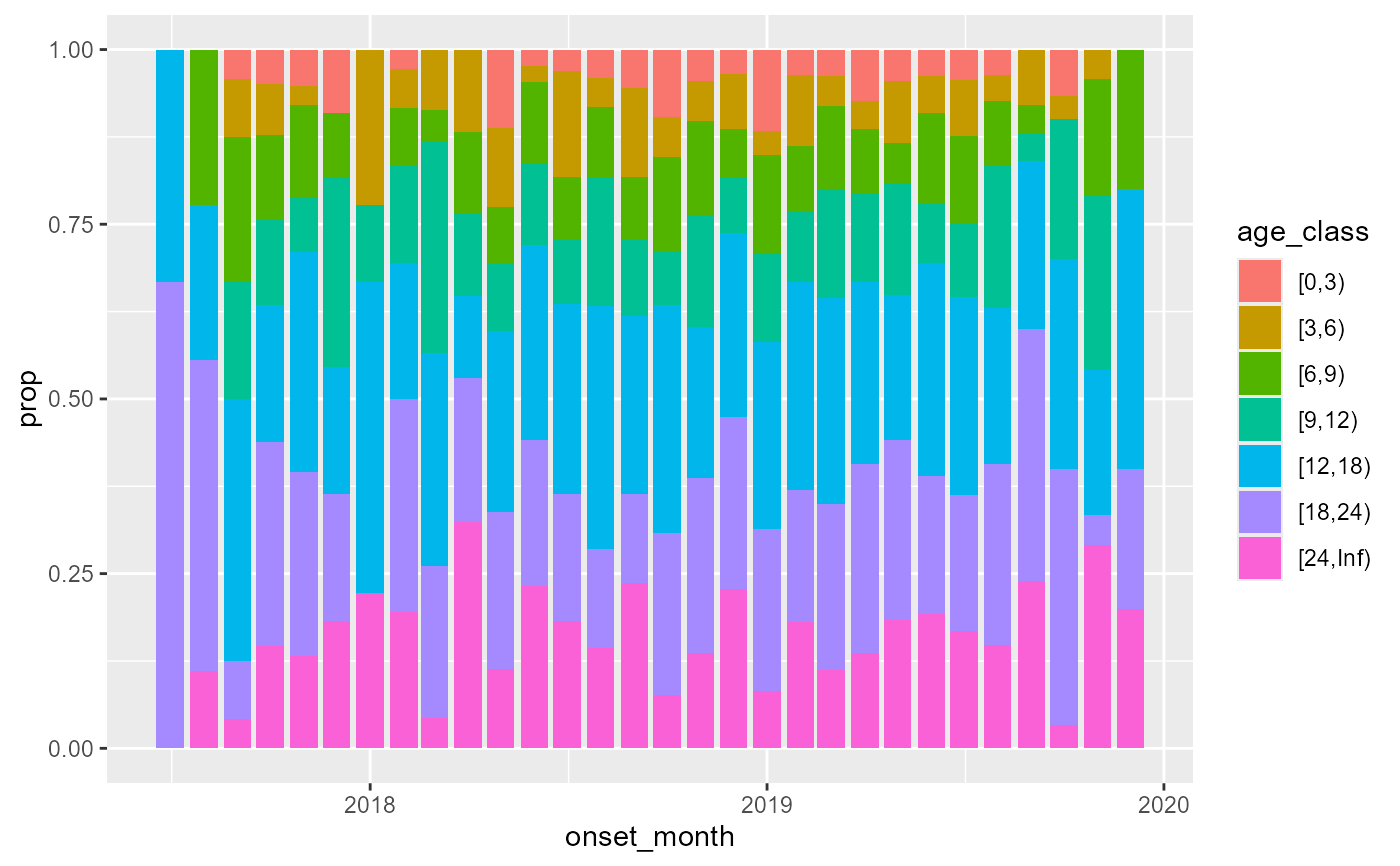
# Add other ggplot elements
outp$plot + ggsci::scale_fill_jco() + ggplot2::theme_minimal()