  id  case_name case_type sex age date_onset date_admission   outcome
1  1 jCQH5RSlVq confirmed   m  22 2023-01-01           <NA> recovered
2  2 AdCD3im7sn  probable   m  21 2023-01-08           <NA> recovered
3  3 iDzmfZhFkV  probable   m  21 2023-01-03           <NA> recovered
4  4 sKipHJsjZ2  probable   m  10 2023-01-10           <NA>      died
5  5 xG7GvAjlBf suspected   m  24 2023-01-05           <NA> recovered
6  7 ZWWcBMLzoH confirmed   m  10 2023-01-04           <NA> recovered
  date_outcome date_first_contact date_last_contact   district     outbreak
1         <NA>               <NA>              <NA>   Tan Binh 1st outbreak
2         <NA>         2022-12-31        2023-01-04    Tan Phu 1st outbreak
3         <NA>         2022-12-29        2023-01-05   Binh Tan 1st outbreak
4   2023-01-27         2023-01-10        2023-01-13    Quan 10 1st outbreak
5         <NA>         2023-01-07        2023-01-07    Quan 12 1st outbreak
6 <NA> 2023-01-06 2023-01-07 Binh Thanh 1st outbreakUsing Quarto for reproducible research
Thinh Ong and Tuyen Huynh
What is Quarto?
A publishing system for creating documents, presentations, websites…
Can build HTML, PDF, Microsoft Word…
Combines Markdown and R/Python/Julia code for reproducible workflows
Integrated into RStudio by default
How does Quarto work?
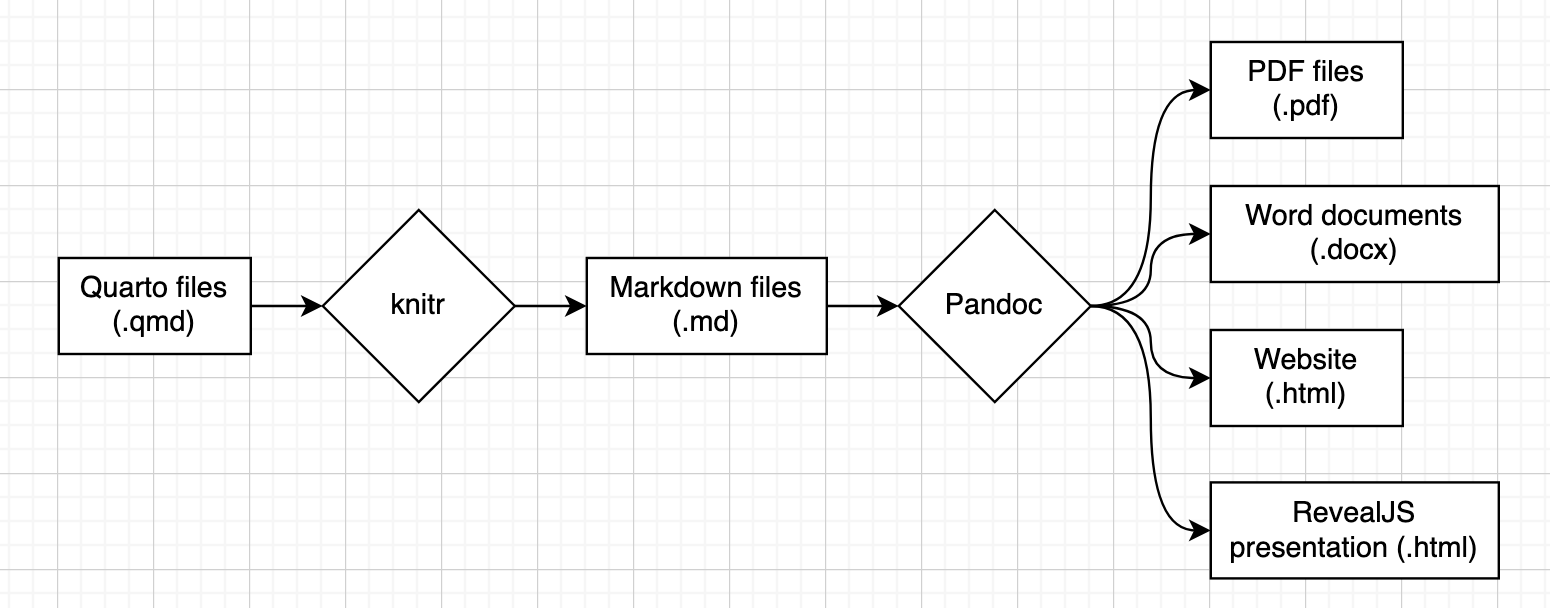
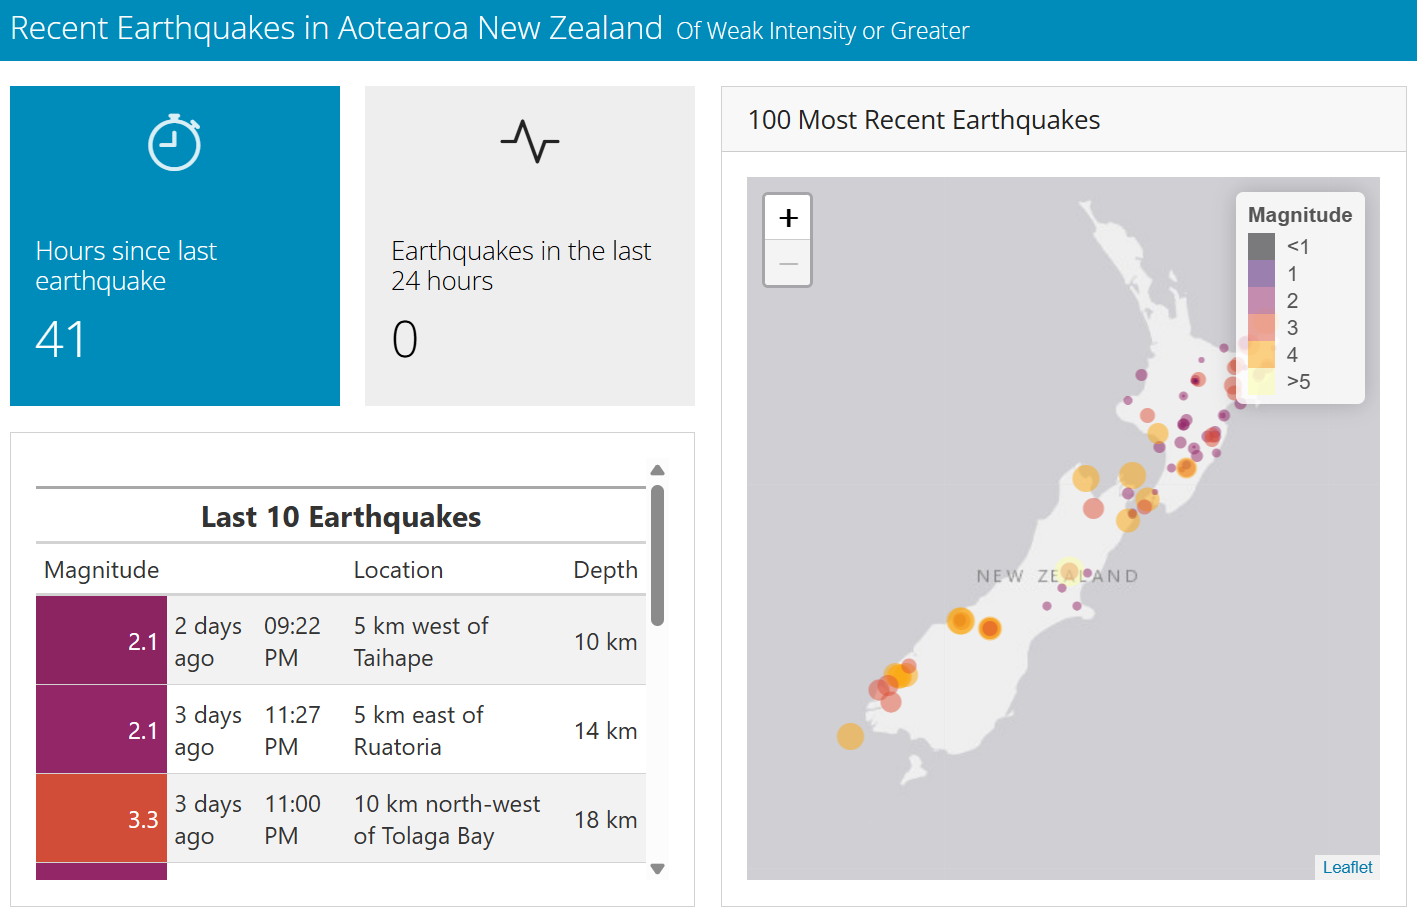
What can Quarto do?
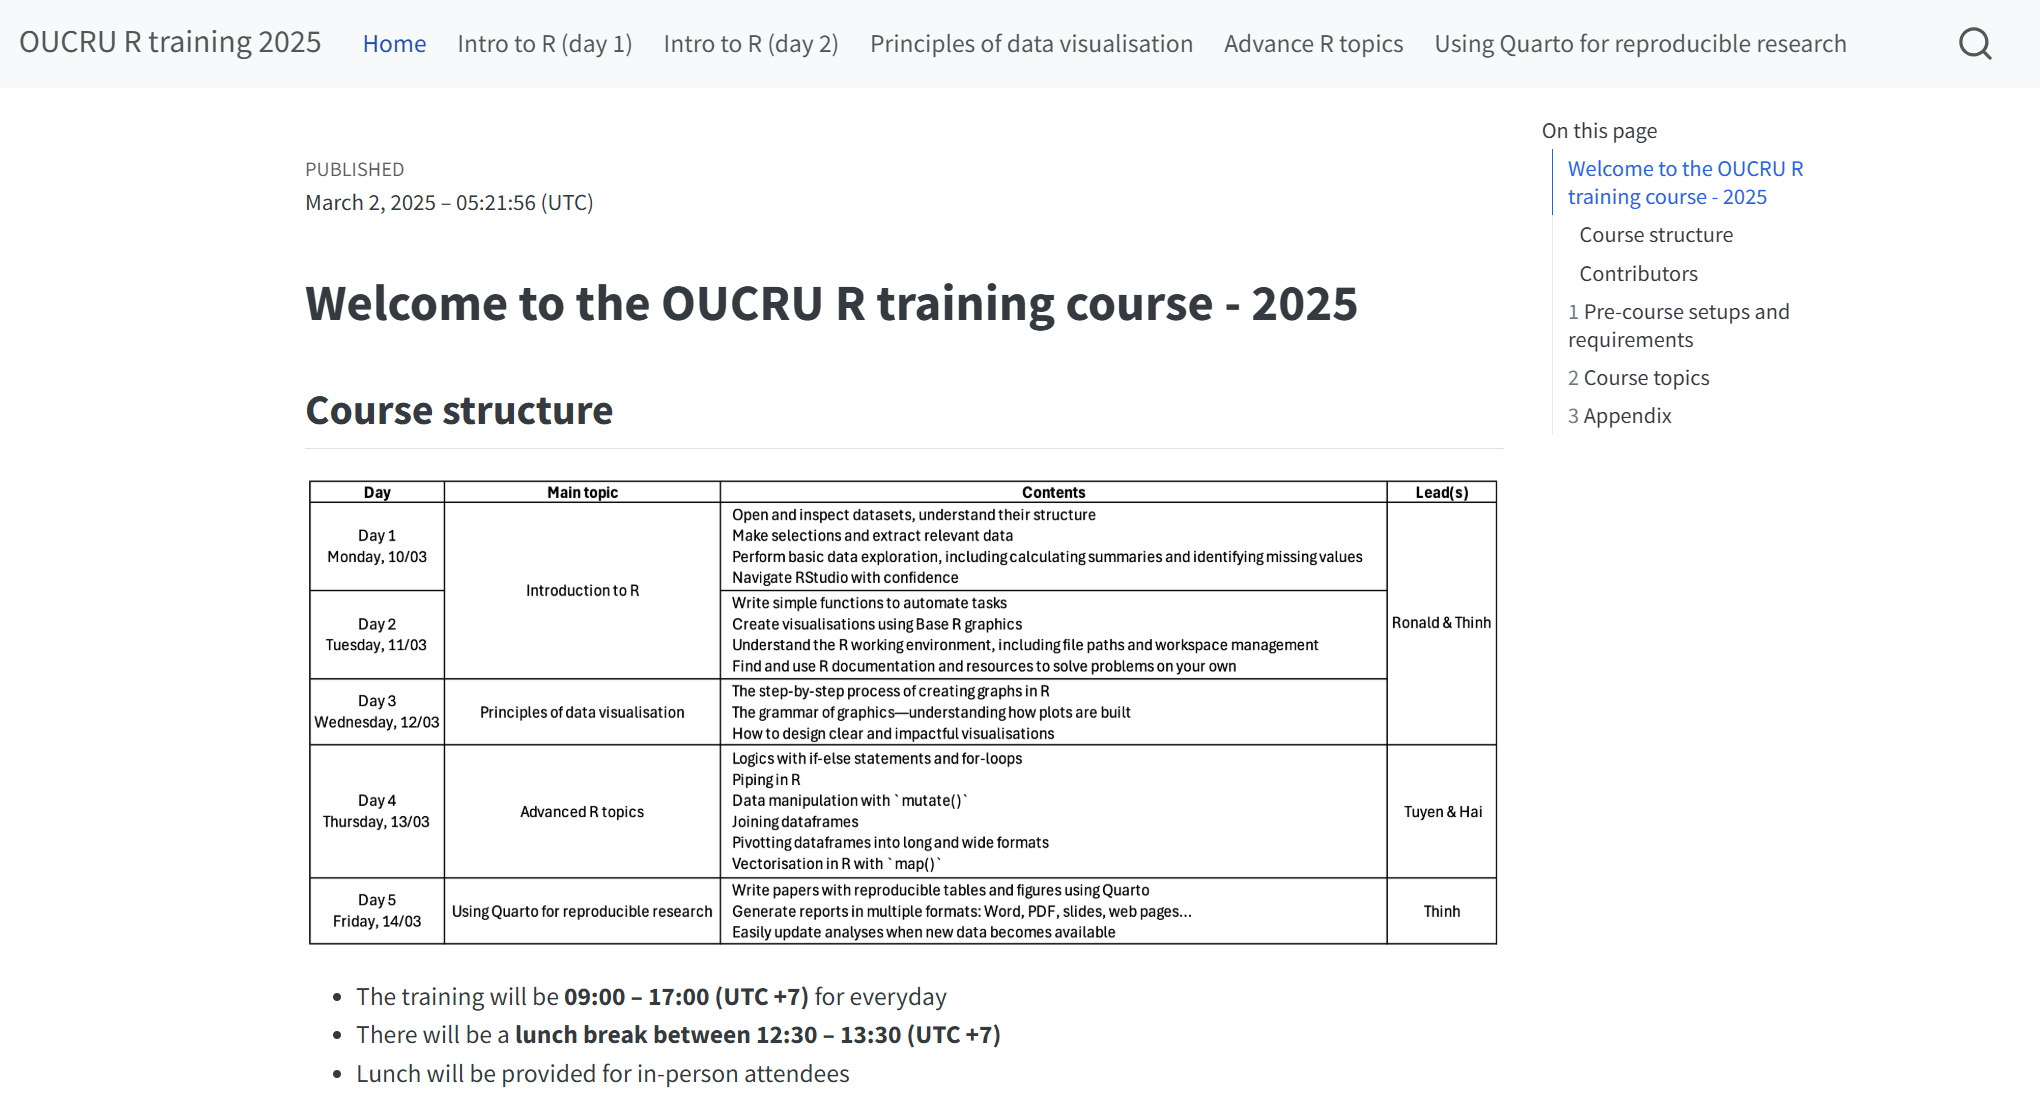
Website
Presentation
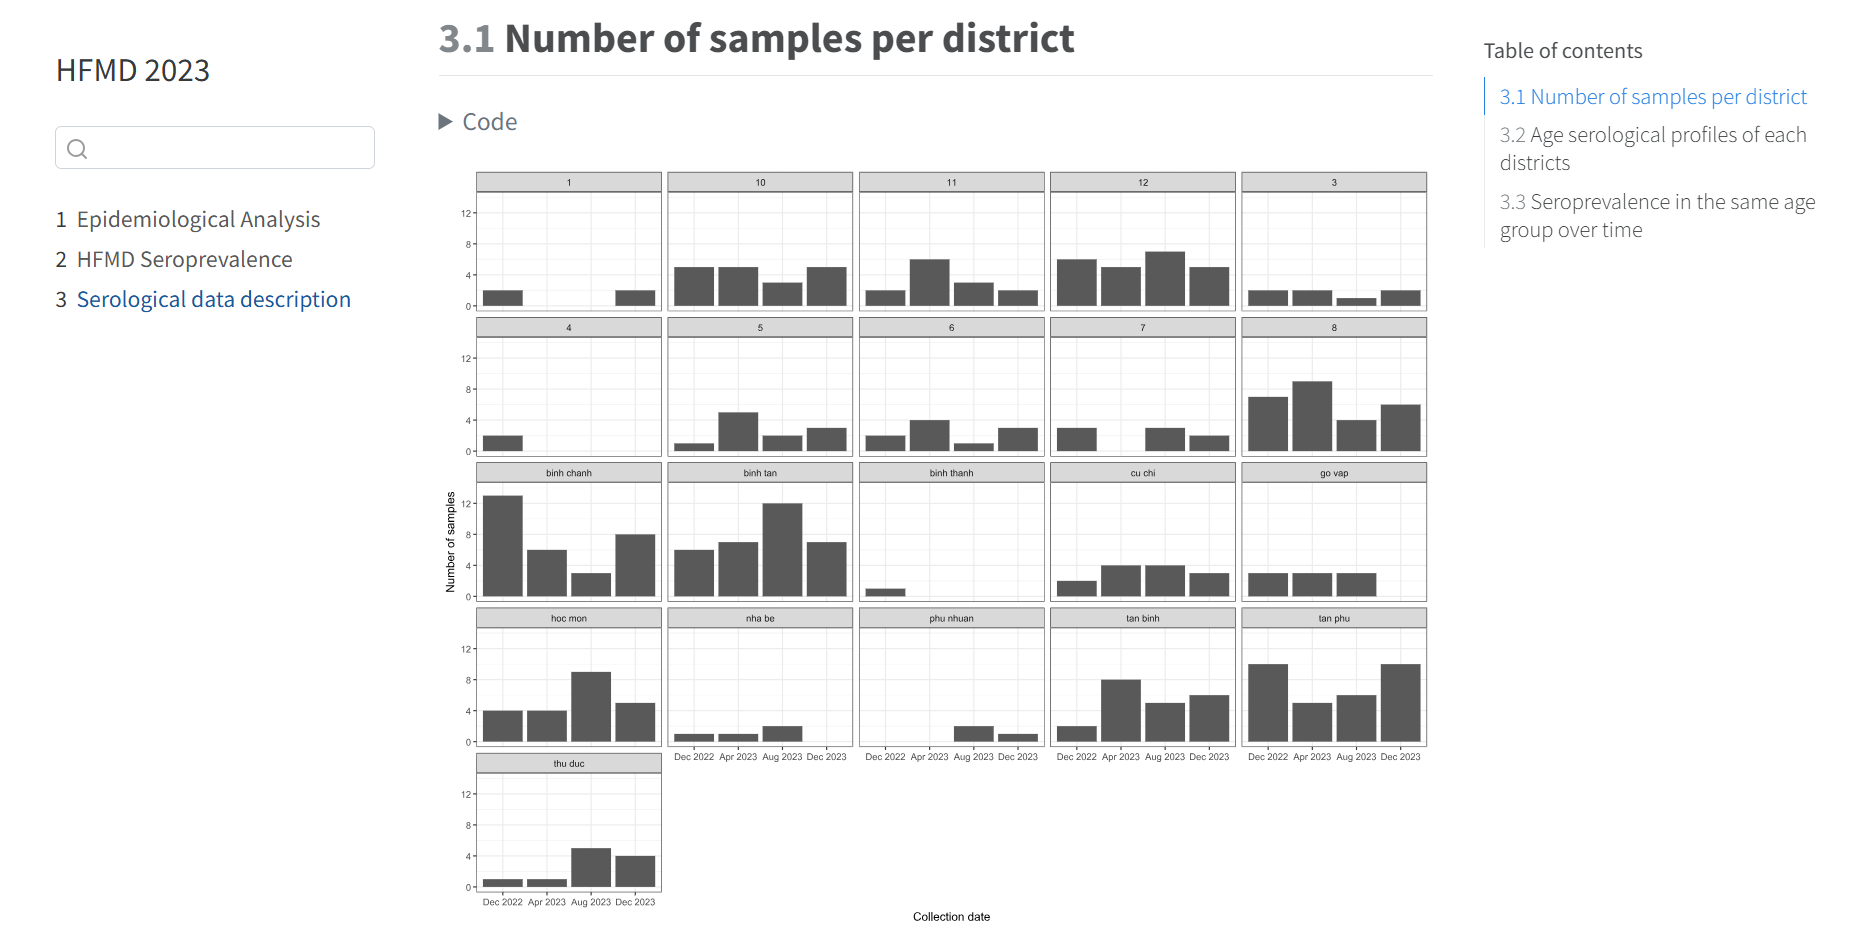
Report/Manuscript
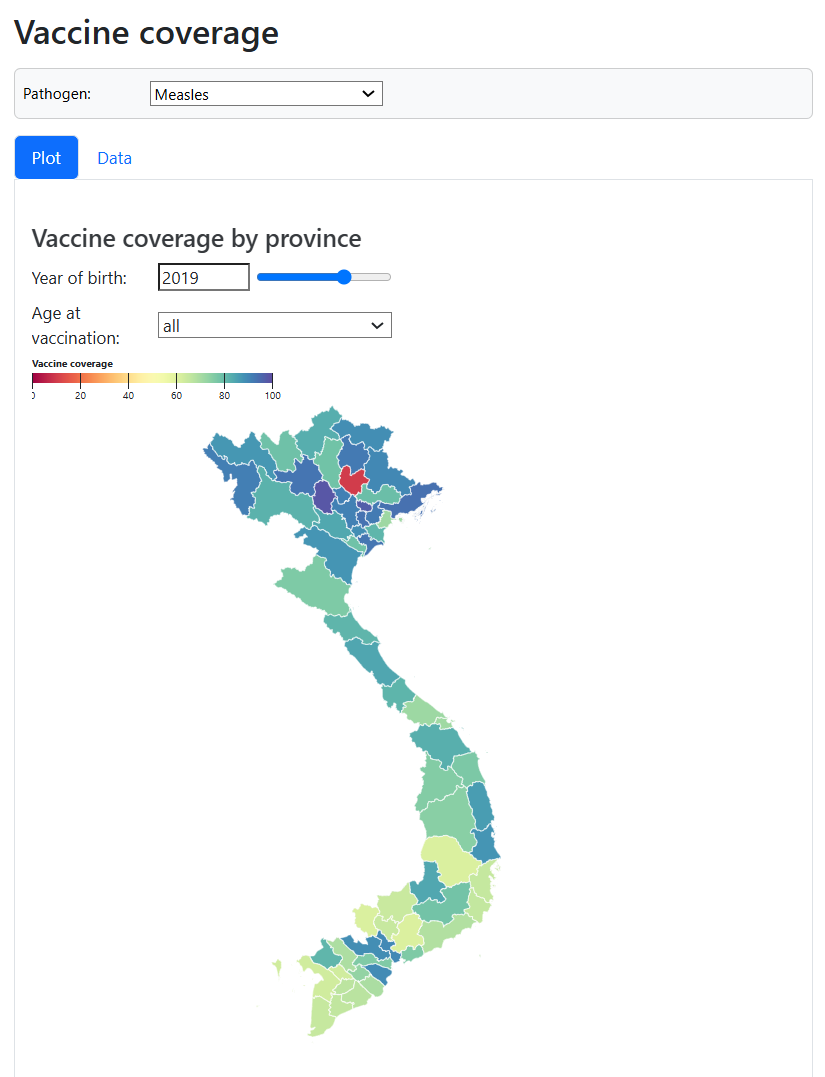
Dashboard
More examples
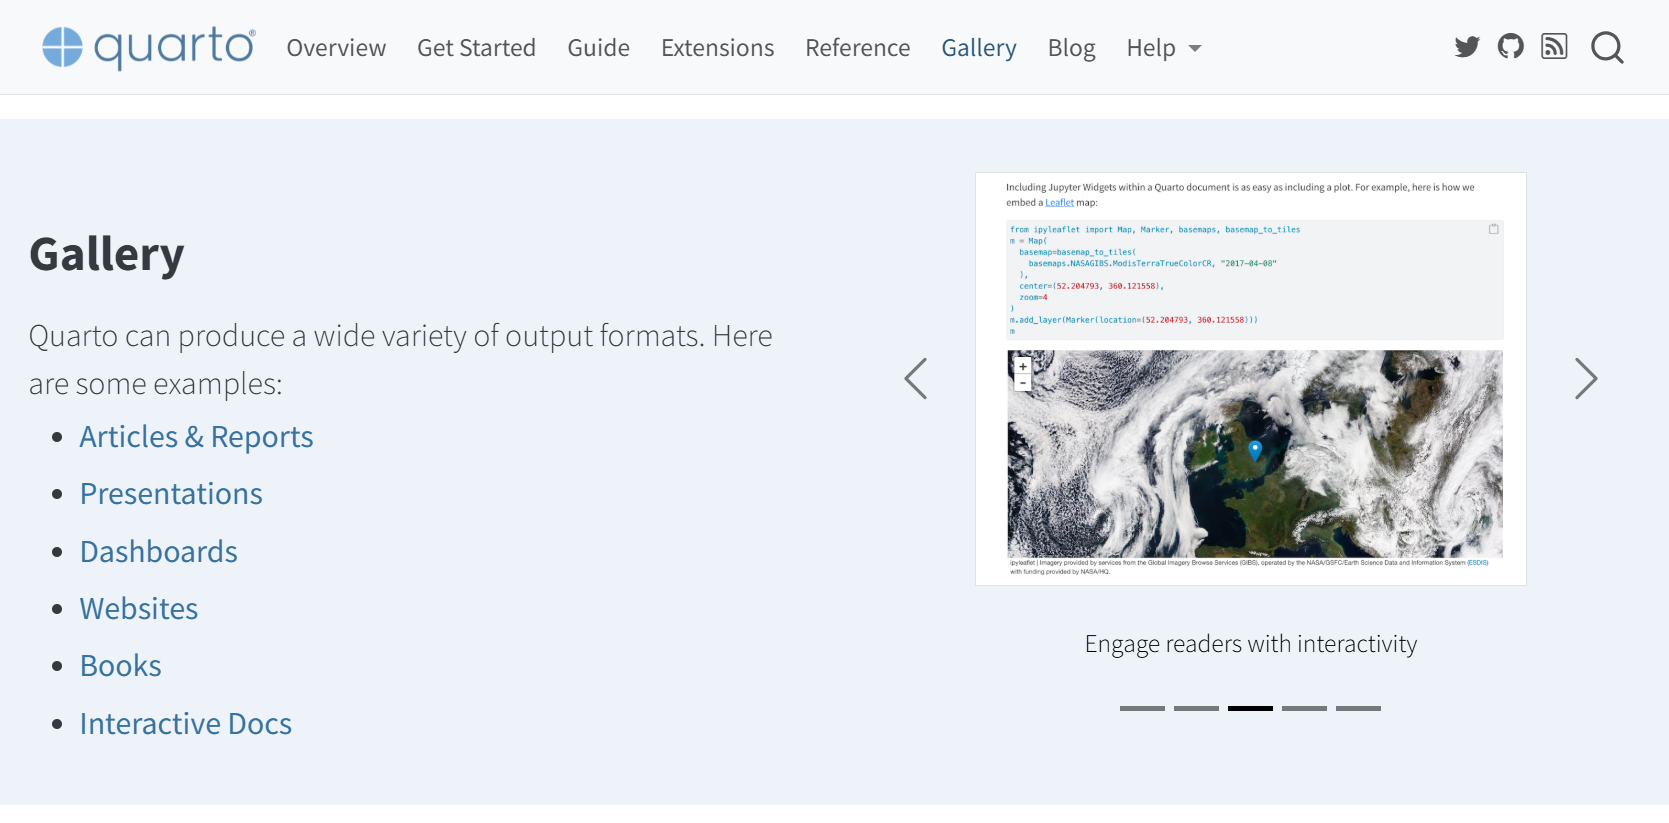
Or click here
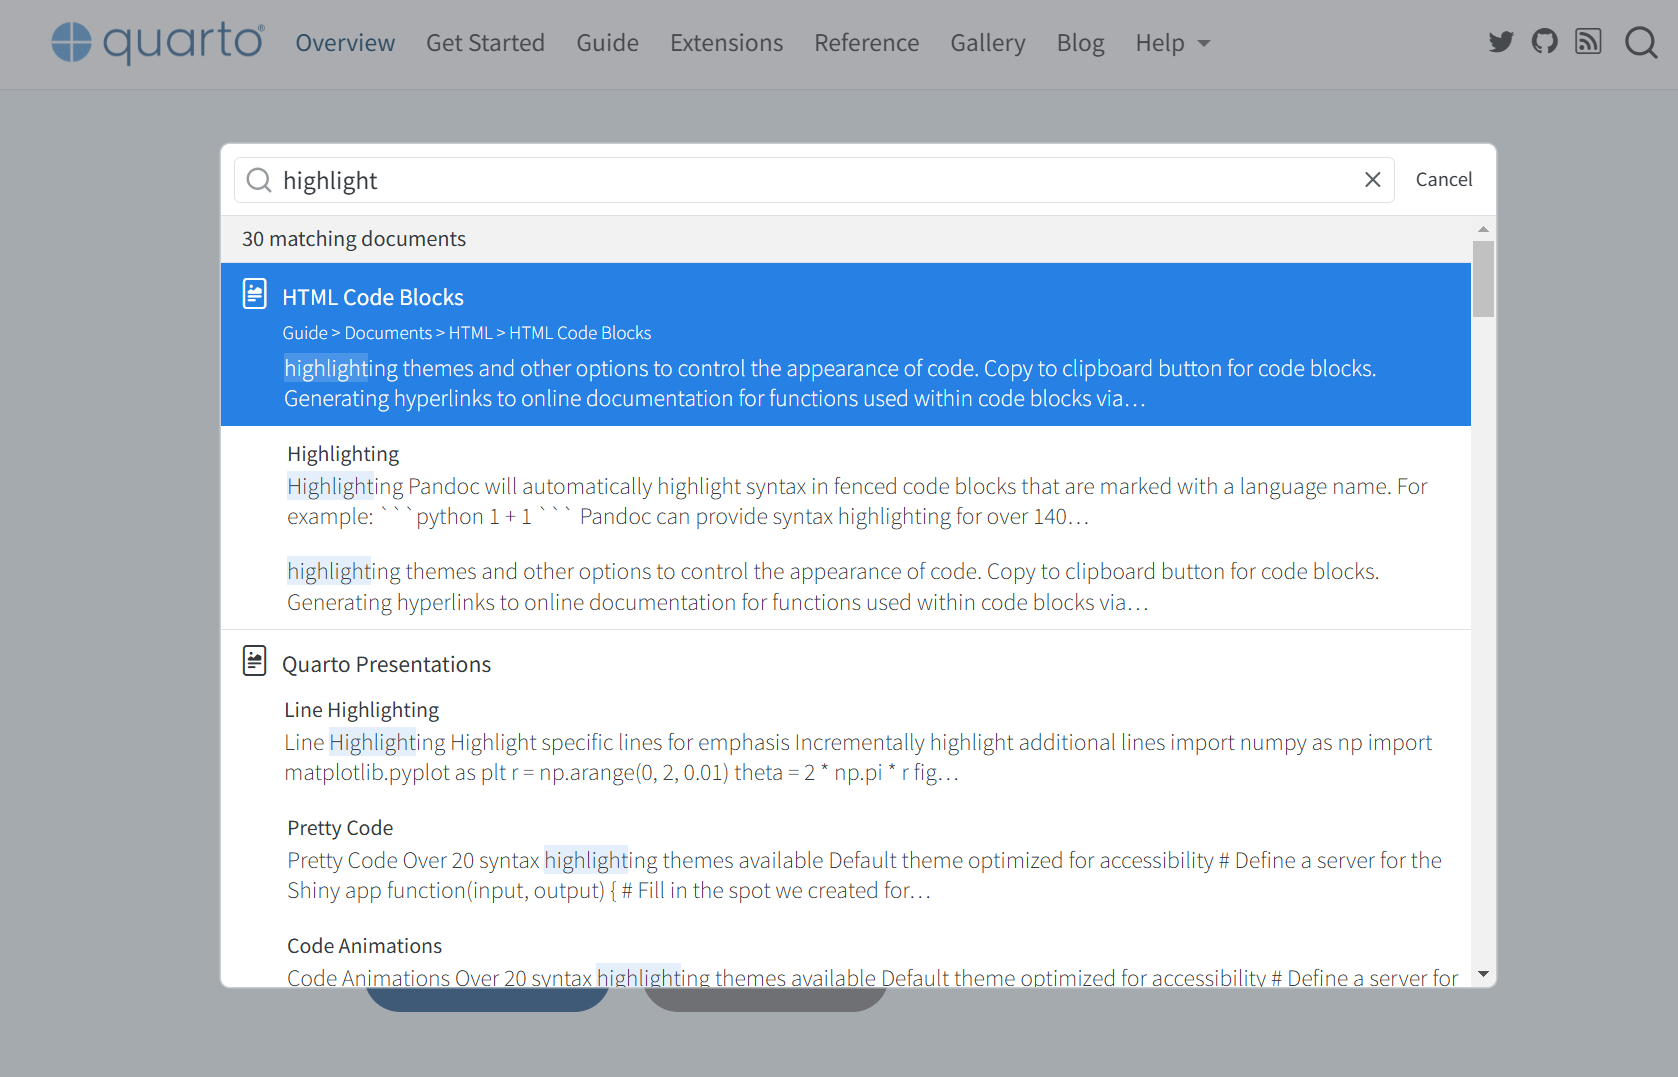
Exploring Quarto
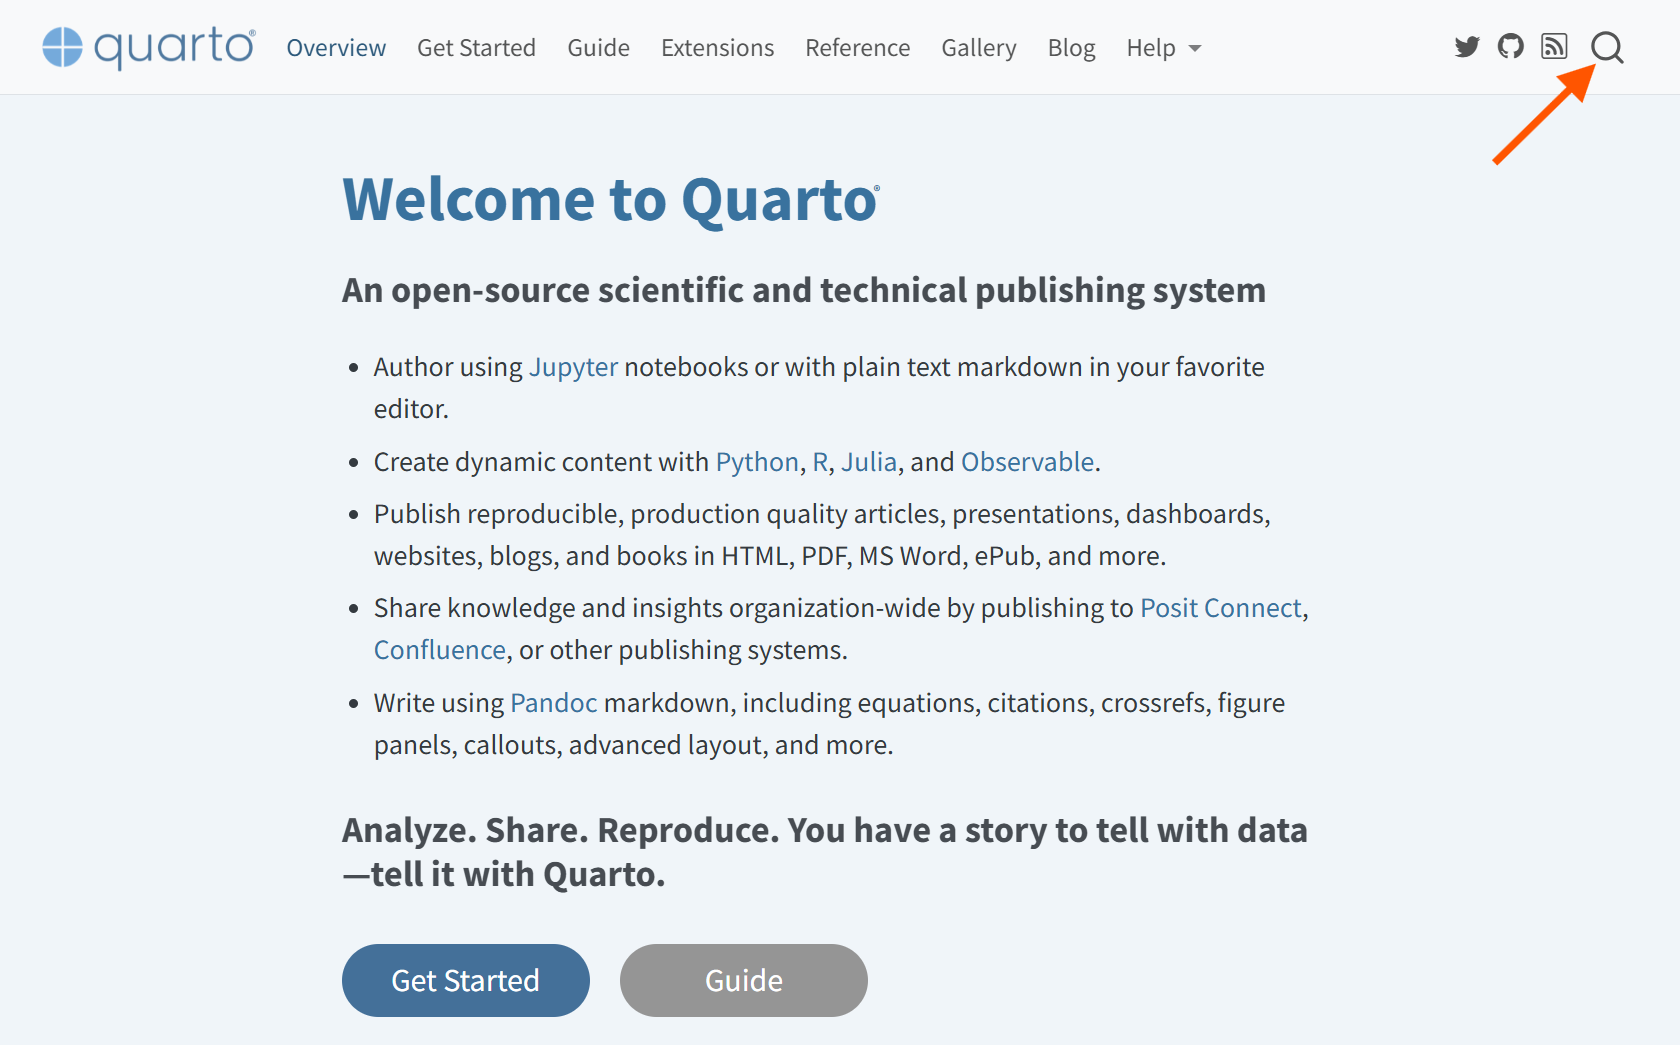
Exploring Quarto
Creating a Quarto file
- Open RStudio
- Go to File > New File > Quarto Document
- Select the format you want
- Save the file with a
.qmdextension
How to use Quarto?
Header
Defines document properties and settings, for examples:
title: Document titleauthor: Authorshipdate: Date this document was publishedformat:- Webpage:
html - Presentation:
revealjs - MS Word:
docx - Report/Manuscript:
pdf
- Webpage:
toc: table of contents
Body
index.qmd
---
title: "Hello, Quarto"
date: 2025-01-06
author: "Biostats and Modelling"
format:
html:
code-overflow: wrap
embed-resources: true
number-sections: true
navbar: false
toc: false
---
## Introduction to Quarto
Quarto is a publishing system that allows you to create documents, presentations, websites, and more using Markdown syntax and additional tools.
## Header Levels
Quarto supports multiple header levels to create a hierarchical structure in your document. For example:
- Level 1 header: `# Header`
- Level 2 header: `## Subheader`
- Level 3 header: `### Sub-subheader`
### Nested Headers
Using headers, you can create nested sections to structure your document in a clear and organized way.
## Inline Text Formatting
You can format your text inline to add emphasis or other styling options.
- **Bold text**: `**bold**`
- *Italic text*: `*italic*`
- Inline `code`: `` `code` ``
- [Underline]{.underline}: `[underline]{.underline}`
> Blockquotes can be used to highlight important information or quotes by adding `> ` at the beginning of a line.
## Lists
Quarto supports both ordered and unordered lists.
### Unordered List
To create an unordered list, use an asterisk `*` before each item:
* First item
* Second item
* Third item
### Ordered List
To create an ordered list, use numbers before each item:
1. First item
2. Second item
3. Third item
## Links and images
<http://example.com>
[linked phrase](http://example.com)

## Tables
| First Header | Second Header |
|--------------|---------------|
| Content Cell | Content Cell |
| Content Cell | Content Cell |
## Code block
Quarto also supports code blocks, making it easy to include and execute code within your document. Here’s an example of a code block to create a simple plot using R:
```{r}
#| fig-width: 4
#| fig-height: 3
#| out-width: "100%"
x <- c(1, 2, 3, 4, 5)
y <- c(1, 4, 9, 16, 25)
plot(x, y, type = "o", col = "blue", main = "Simple plot", xlab = "x", ylab = "y")
```
## Footnotes
Footnotes can be added inline to provide additional information or references. Here's an example of a footnote in Quarto: ^[This is an example footnote.]index.html
MS Word-like interface
Rendering output
- Save your Quarto file.
- Render it using the “Render” button in RStudio or by pressing
Ctrl+Shift+K.

Let’s write a manuscript
Create tables
Data
First let’s load the packages and have a look at the dataset simulated_covid.rds.
Descriptive tables
Fix the labels
| Characteristic | N = 2,7621 |
|---|---|
| Sex | |
| f | 1,365 (49%) |
| m | 1,397 (51%) |
| Age (years) | 15 (8, 22) |
| Outcome | |
| died | 220 (8.0%) |
| recovered | 2,542 (92%) |
| Outbreak | |
| 1st outbreak | 1,513 (55%) |
| 2nd outbreak | 1,249 (45%) |
| 1 n (%); Median (Q1, Q3) | |
Correct the values
| Characteristic | N = 2,7621 |
|---|---|
| Sex | |
| Female | 1,365 (49%) |
| Male | 1,397 (51%) |
| Age (years) | 15 (8, 22) |
| Outcome | |
| Died | 220 (8.0%) |
| Recovered | 2,542 (92%) |
| Outbreak | |
| 1st outbreak | 1,513 (55%) |
| 2nd outbreak | 1,249 (45%) |
| 1 n (%); Median (Q1, Q3) | |
Decimal places
df |>
  mutate(sex = factor(
    sex,
    levels = c("f", "m"),
    labels = c("Female", "Male")
  ),
  outcome = str_to_sentence(outcome)) |>
  tbl_summary(
    include = c(sex, age, outcome, outbreak),
    label = list(
      sex ~ "Sex", age ~ "Age (years)",
      outcome ~ "Outcome", outbreak ~ "Outbreak"
    ),
    digits = c(
      all_categorical() ~ c(0, 1),
      all_continuous() ~ 1
    )
)| Characteristic | N = 2,7621 |
|---|---|
| Sex | |
| Female | 1,365 (49.4%) |
| Male | 1,397 (50.6%) |
| Age (years) | 15.0 (8.0, 22.0) |
| Outcome | |
| Died | 220 (8.0%) |
| Recovered | 2,542 (92.0%) |
| Outbreak | |
| 1st outbreak | 1,513 (54.8%) |
| 2nd outbreak | 1,249 (45.2%) |
| 1 n (%); Median (Q1, Q3) | |
Use mean or median
df |>
  mutate(sex = factor(
    sex,
    levels = c("f", "m"),
    labels = c("Female", "Male")
  ),
  outcome = str_to_sentence(outcome)) |>
  tbl_summary(
    include = c(sex, age, outcome, outbreak),
    label = list(
      sex ~ "Sex", age ~ "Age (years)",
      outcome ~ "Outcome", outbreak ~ "Outbreak"
    ),
    digits = c(
      all_categorical() ~ c(0, 1),
      all_continuous() ~ 1
    ),
    statistic = list(
      all_continuous() ~ "{mean} \u00b1 {sd}"
    )
)| Characteristic | N = 2,7621 |
|---|---|
| Sex | |
| Female | 1,365 (49.4%) |
| Male | 1,397 (50.6%) |
| Age (years) | 15.5 ± 9.1 |
| Outcome | |
| Died | 220 (8.0%) |
| Recovered | 2,542 (92.0%) |
| Outbreak | |
| 1st outbreak | 1,513 (54.8%) |
| 2nd outbreak | 1,249 (45.2%) |
| 1 n (%); Mean ± SD | |
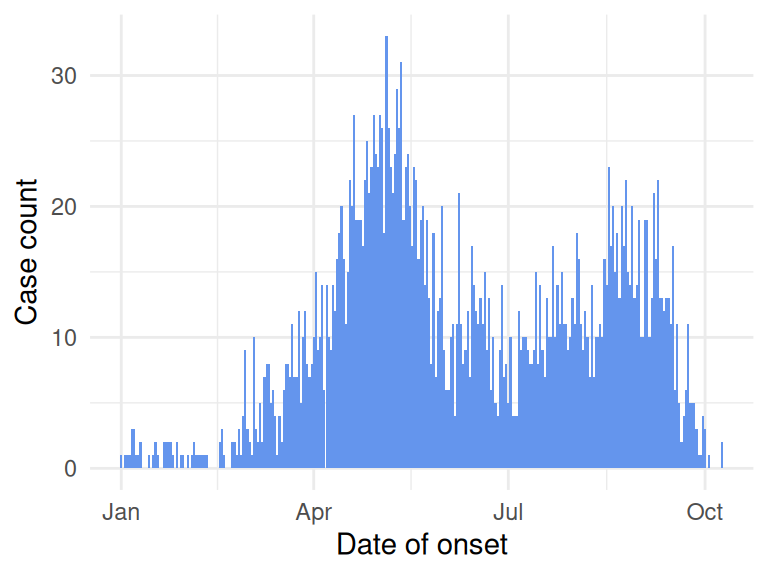
Make a plot
Reuse code with new data
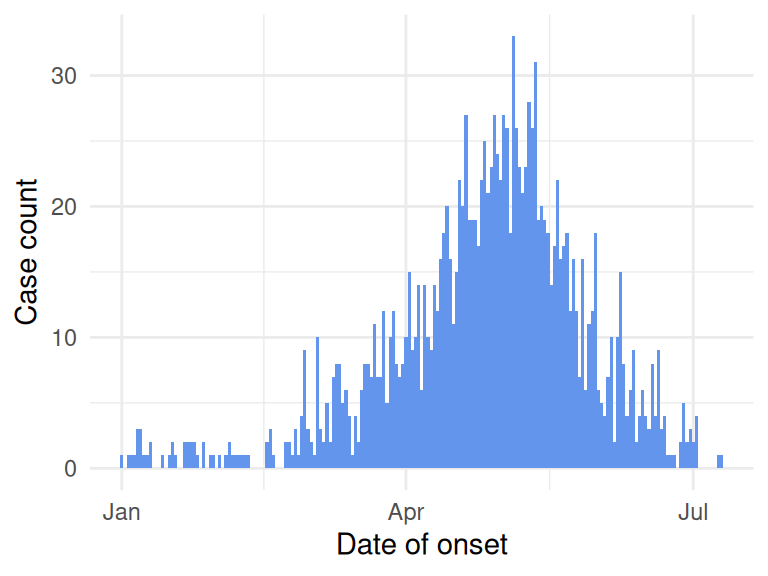
What if we only care about the 1st outbreak?

Reuse code with new data
What if we only care about the 1st outbreak?
Reuse code with new data
df |>
  mutate(sex = factor(
    sex,
    levels = c("f", "m"),
    labels = c("Female", "Male")
  ),
  outcome = str_to_sentence(outcome)) |>
  tbl_summary(
    include = c(sex, age, outcome, outbreak),
    label = list(
      sex ~ "Sex", age ~ "Age (years)",
      outcome ~ "Outcome", outbreak ~ "Outbreak"
    ),
    digits = c(
      all_categorical() ~ c(0, 1),
      all_continuous() ~ 1
    ),
    statistic = list(
      all_continuous() ~ "{mean} \u00b1 {sd}"
    )
)| Characteristic | N = 1,5131 |
|---|---|
| Sex | |
| Female | 746 (49.3%) |
| Male | 767 (50.7%) |
| Age (years) | 12.8 ± 7.6 |
| Outcome | |
| Died | 110 (7.3%) |
| Recovered | 1,403 (92.7%) |
| Outbreak | |
| 1st outbreak | 1,513 (100.0%) |
| 1 n (%); Mean ± SD | |
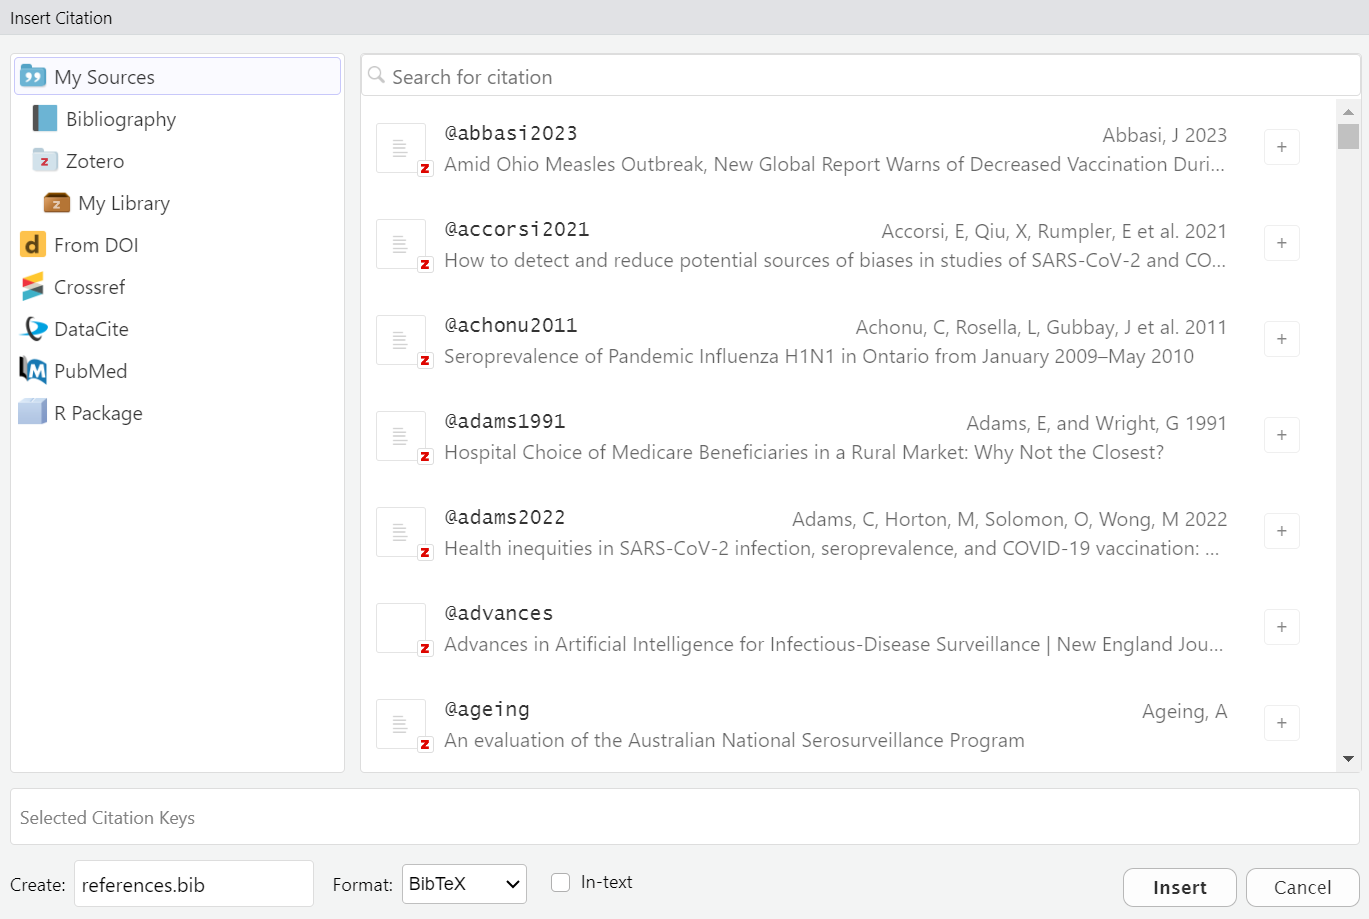
Add citation
You can add citations to the text using Quarto
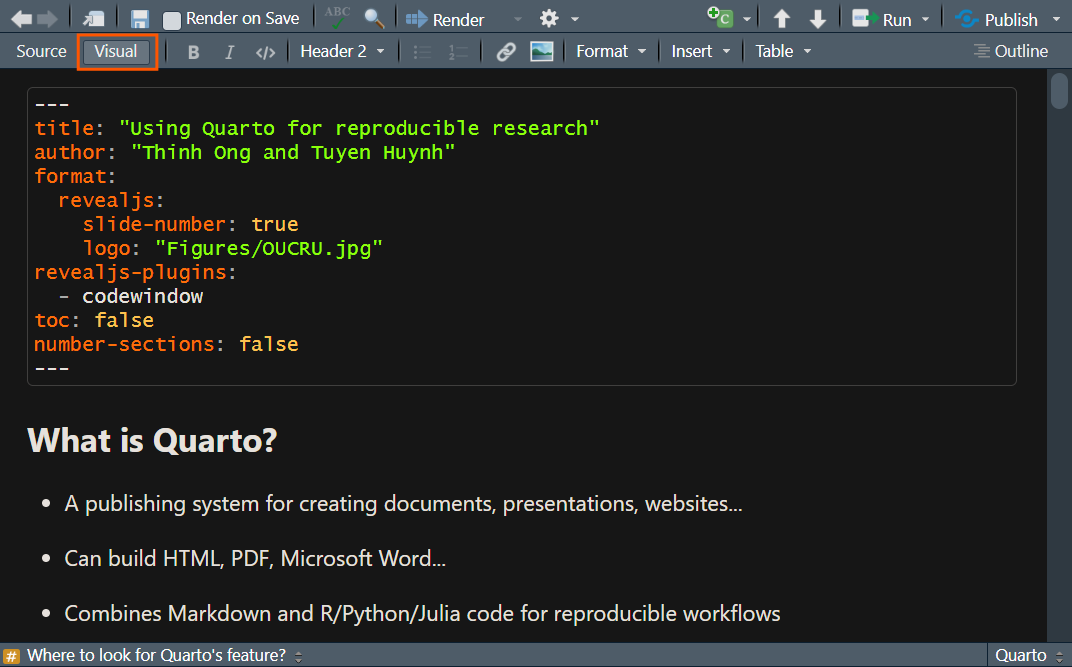
The easiest way to do this is via the
Visualview
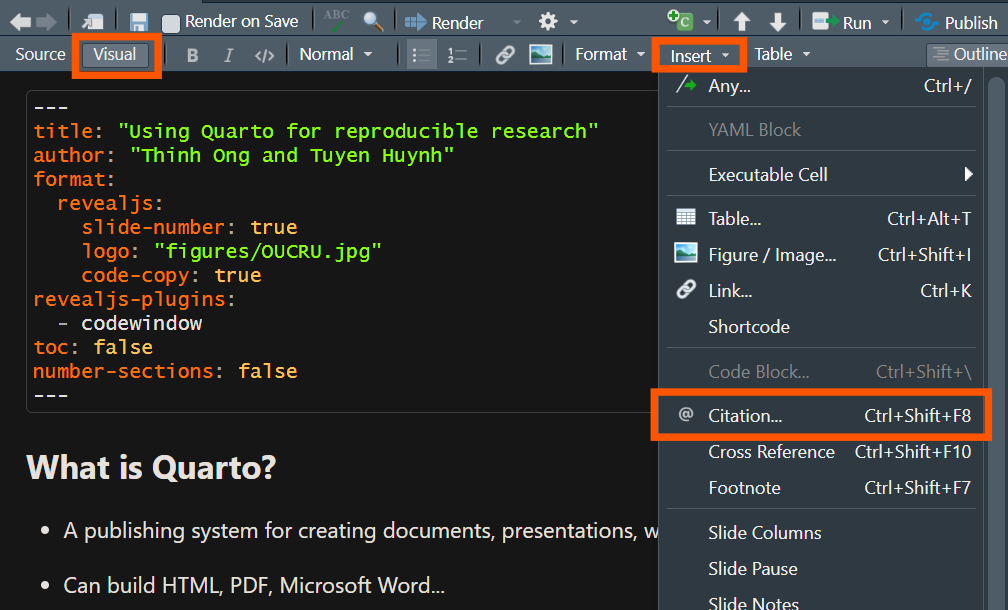
Add citation
Template
Templates help make your document look professional without extra effort
You can use pre-built templates or create your own for a custom style
Some templates are designed for academic journals, presentations, or reports
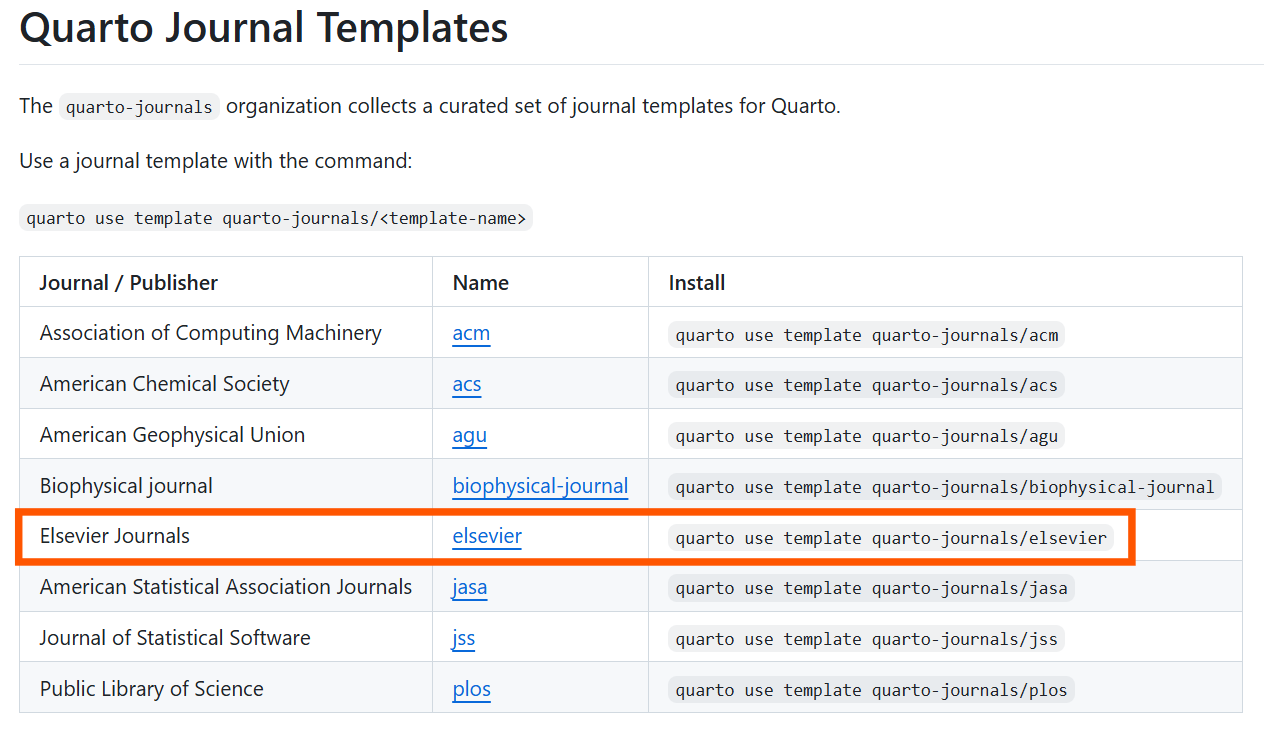
Click here to see a list of available journal templates in Quarto
What is a Quarto template?
A Quarto template is a pre-designed document layout that controls the appearance of your output (PDF, Word, HTML, or presentation).
Let’s try a template for journals published by Elsevier.
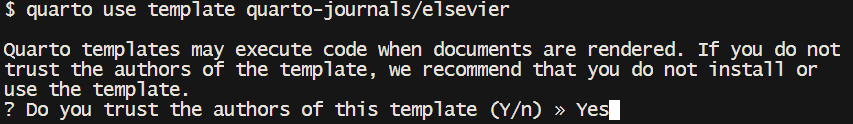
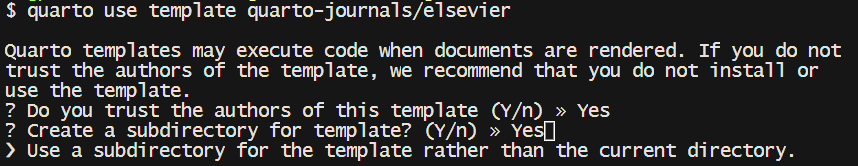
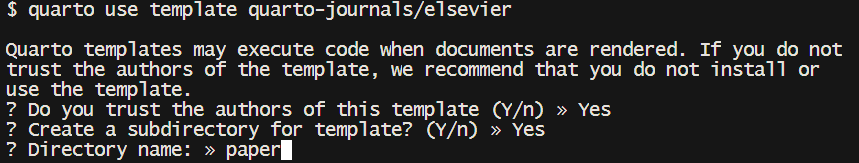
Template
Paste this code in the terminal (not the console or your coding panel).
Say “Yes” to everything it gonna ask.
Template
paper.qmd
---
title: Short Paper
subtitle: A Short Subtitle
author:
  - name: Alice Anonymous
    email: alice@example.com
    affiliations:
        - id: some-tech
          name: Some Institute of Technology
          department: Department Name
          address: Street Address
          city: City
          state: State
          postal-code: Postal Code
    attributes:
        corresponding: true
    note: This is the first author footnote.
  - name: Bob Security
    email: bob@example.com
    affiliations:
        - id: another-u
          name: Another University
          department: Department Name
          address: Street Address
          city: City
          state: State
          postal-code: Postal Code
    note: |
      Another author footnote, this is a very long footnote and it should be a really long footnote. But this footnote is not yet sufficiently long enough to make two lines of footnote text.
  - name: Cat Memes
    email: cat@example.com
    affiliations:
        - ref: another-u
    note: Yet another author footnote.
  - name: Derek Zoolander
    email: derek@example.com
    affilations:
        - ref: some-tech
abstract: |
  This is the abstract. Lorem ipsum dolor sit amet, consectetur adipiscing elit. Vestibulum augue turpis, dictum non malesuada a, volutpat eget velit. Nam placerat turpis purus, eu tristique ex tincidunt et. Mauris sed augue eget turpis ultrices tincidunt. Sed et mi in leo porta egestas. Aliquam non laoreet velit. Nunc quis ex vitae eros aliquet auctor nec ac libero. Duis laoreet sapien eu mi luctus, in bibendum leo molestie. Sed hendrerit diam diam, ac dapibus nisl volutpat vitae. Aliquam bibendum varius libero, eu efficitur justo rutrum at. Sed at tempus elit.
keywords:
  - keyword1
  - keyword2
date: last-modified
bibliography: bibliography.bib
format:
  elsevier-pdf:
    keep-tex: true
    journal:
      name: Journal Name
      formatting: preprint
      # model: 3p # Don't set a model with preprint
      cite-style: authoryear
---

Please make sure that your manuscript follows the guidelines in the
Guide for Authors of the relevant journal. It is not necessary to
typeset your manuscript in exactly the same way as an article,
unless you are submitting to a camera-ready copy (CRC) journal.

For detailed instructions regarding the elsevier article class, see   <https://www.elsevier.com/authors/policies-and-guidelines/latex-instructions>

# Bibliography styles

Here are two sample references:  @Feynman1963118 @Dirac1953888.

With this template using elsevier class, natbib will be used. Three bibliographic style files (*.bst) are provided and their use controled by `cite-style` option:

- `citestyle: number` (default)  will use `elsarticle-num.bst` - can be used for the numbered scheme
- `citestyle: numbername` will use `elsarticle-num-names.bst` - can be used for numbered with new options of natbib.sty
- `citestyle: authoryear` will use `elsarticle-harv.bst` — can be used for author year scheme

This `citestyle` will insert the right `.bst` and set the correct `classoption` for `elsarticle` document class.

Using `natbiboptions` variable in YAML header, you can set more options for `natbib` itself . Example

```yaml
natbiboptions: longnamesfirst,angle,semicolon
```

## Using CSL

If `cite-method` is set to `citeproc` in `elsevier_article()`, then pandoc is used for citations instead of `natbib`. In this case, the `csl` option is used to format the references. By default, this template will provide an appropriate style, but alternative `csl` files are available from <https://www.zotero.org/styles?q=elsevier>. These can be downloaded
and stored locally, or the url can be used as in the example header.

# Equations

Here is an equation:
$$
  f_{X}(x) = \left(\frac{\alpha}{\beta}\right)
  \left(\frac{x}{\beta}\right)^{\alpha-1}
  e^{-\left(\frac{x}{\beta}\right)^{\alpha}};
  \alpha,\beta,x > 0 .
$$

Inline equations work as well: $\sum_{i = 2}^\infty\{\alpha_i^\beta\}$

# Figures and tables

@fig-meaningless is generated using an R chunk.

```{r}
#| label: fig-meaningless
#| fig-cap: A meaningless scatterplot
#| fig-width: 5
#| fig-height: 5
#| fig-align: center
#| out-width: 50%
#| echo: false
plot(runif(25), runif(25))
```

# Tables coming from R

Tables can also be generated using R chunks, as shown in @tbl-simple example.

```{r}
#| label: tbl-simple
#| tbl-cap: Caption centered above table
#| echo: true
knitr::kable(head(mtcars)[,1:4])
```

# References {-}
Let’s make a presentation
Revealjs
- Quarto + Revealjs = Interactive Presentations
- Uses Markdown for content
- Simple, flexible, and powerful!
Slide structure
- Set
format: revealjs - Use
##for slide titles and Markdown for content
Slide structure
Now create your own Quarto manuscript and presentation!
