Generate table of metrics for model comparison
Arguments
- data
input data to fit into the models
- method
method to compare models. Can be one of the built-in methods or a function to compute the returned metrics (see Details).
- ...
models to be compared. Must be models created by serosv. If models' names are not provided, indices will be used instead for the `model` column in the returned data.frame.
Value
a data.frame with the following columns
- label
name or index of the model
- type
model type of the given model (a serosv model name)
- metrics columns
the columns for metrics of comparison, the number of which depends on the function that generate these metrics
Details
Built-in comparison methods include:
computing AIC and BIC, which returns AIC, BIC values of the model if available
cross validation (perform k-fold validation), which returns MSE and logloss (negative log Binomial likelihood) for aggregated data, or AUC and logloss (negative log Bernoulli likelihood) for linelisting data
Examples
comparison_table <- suppressWarnings(
compare_models(
data = hav_bg_1964,
method = "CV",
polynomial_mod = ~polynomial_model(.x, k=1),
penalized_spline = penalized_spline_model,
farrington = ~farrington_model(.x, start=list(alpha=0.3,beta=0.1,gamma=0.03))
)
)
# view table of metrics
comparison_table
#> # A tibble: 3 × 6
#> label mse logloss type mod_out plots
#> <chr> <dbl> <dbl> <chr> <list> <list>
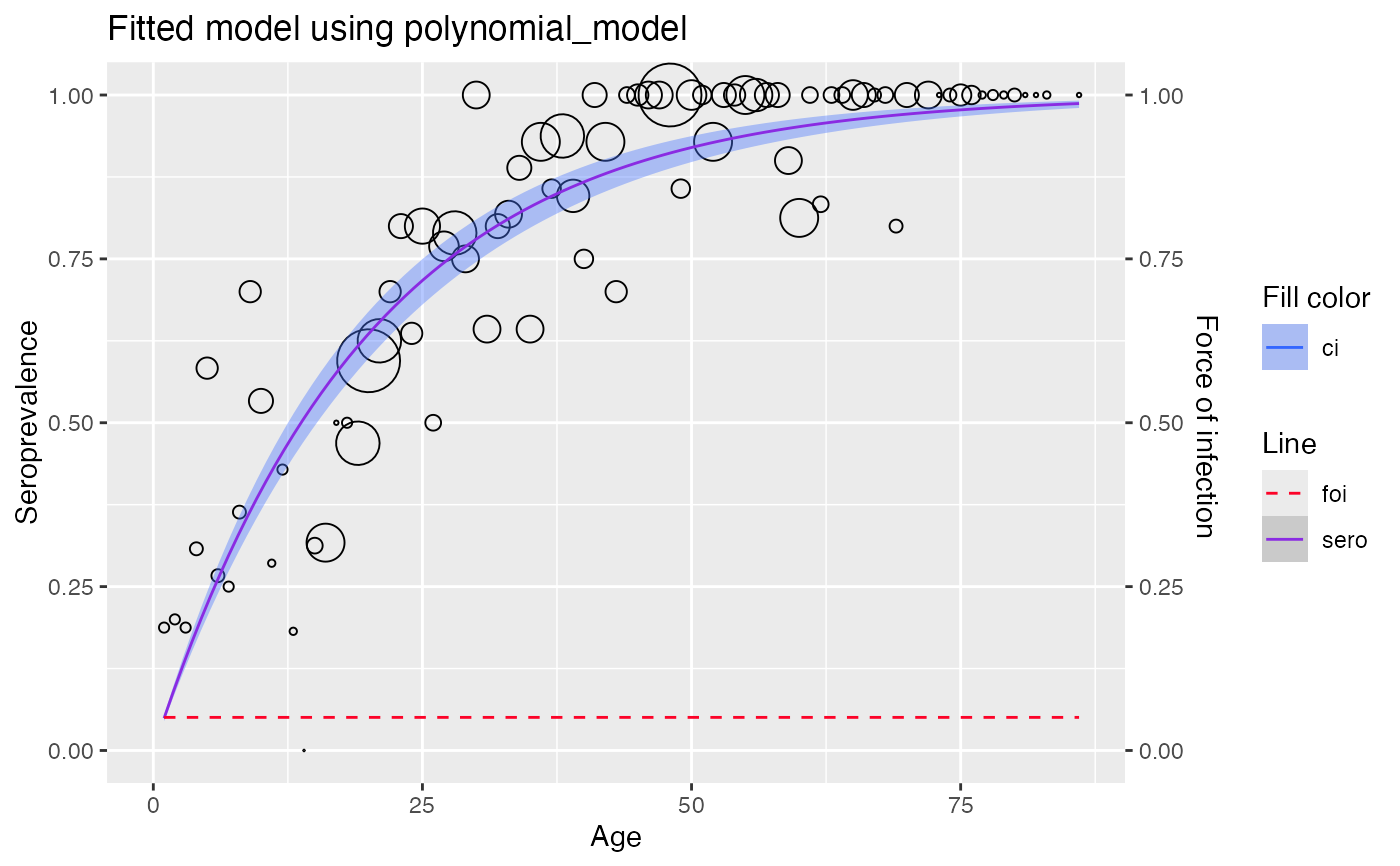
#> 1 polynomial_mod 0.554 287. polynomial_model <plynml_m> <gg>
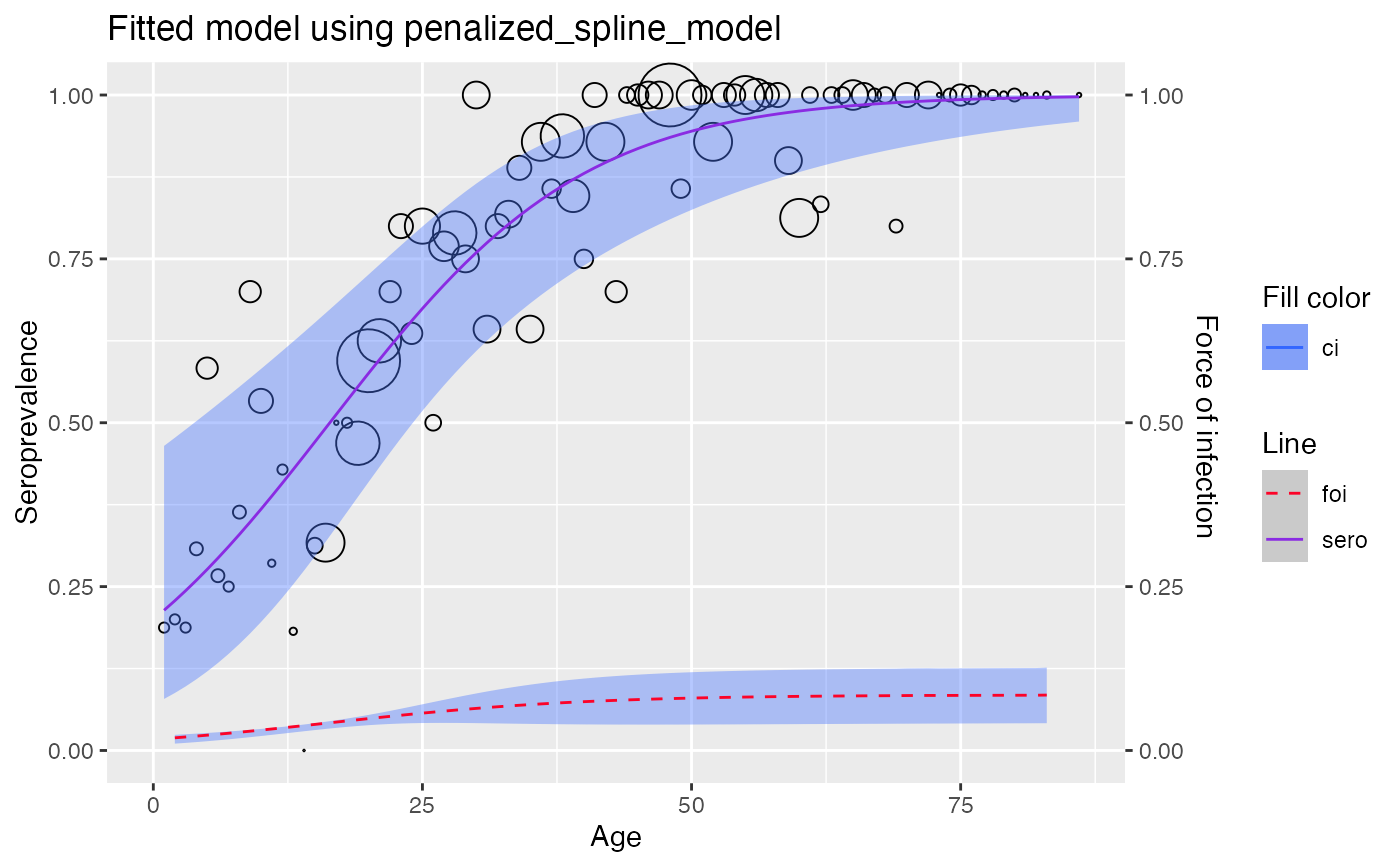
#> 2 penalized_spline 0.0151 26.6 penalized_spline_model <pnlzd_s_> <gg>
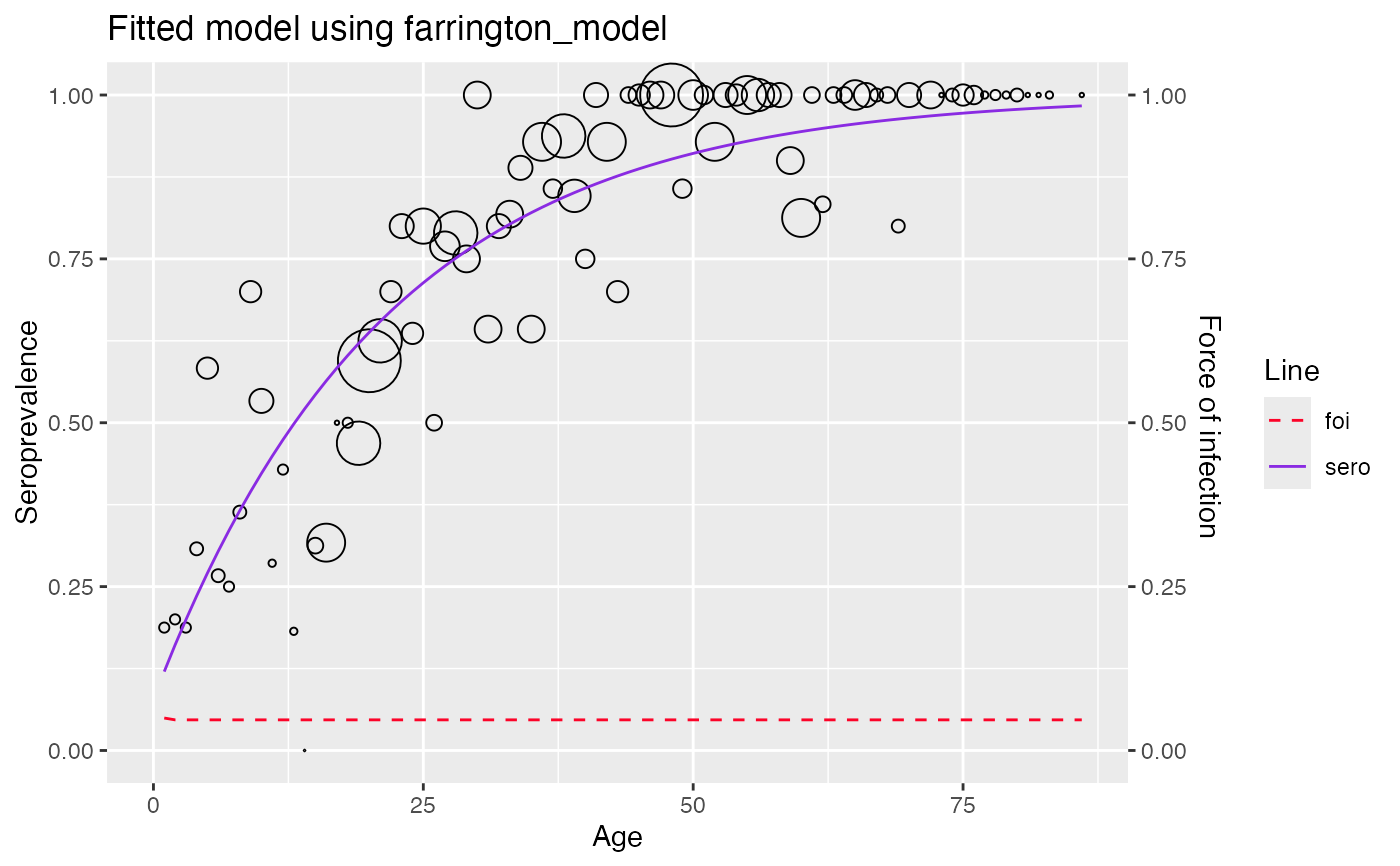
#> 3 farrington 0.0181 33.6 farrington_model <frrngtn_> <gg>
# view the model fitted with the whole dataset
comparison_table$plots
#> [[1]]
 #>
#> [[2]]
#>
#> [[2]]
 #>
#> [[3]]
#> Warning: No shared levels found between `names(values)` of the manual scale and the
#> data's fill values.
#>
#> [[3]]
#> Warning: No shared levels found between `names(values)` of the manual scale and the
#> data's fill values.
 #>
#>