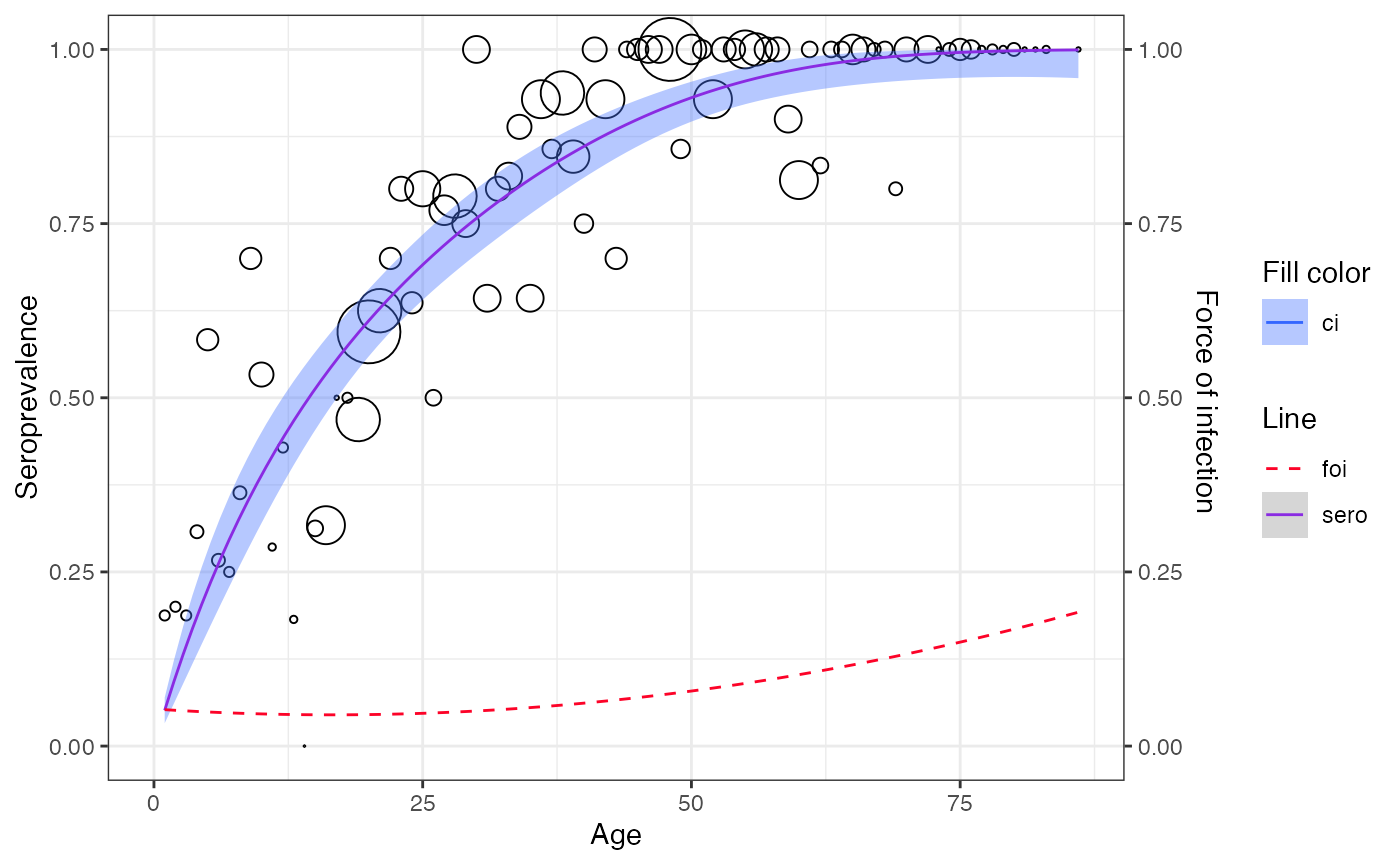
Visualize model
To visualize the model, user can simply use function
plot
If implementation for confidence interval calculation is not yet
available, plot function would simply visualize
seroprevalence line
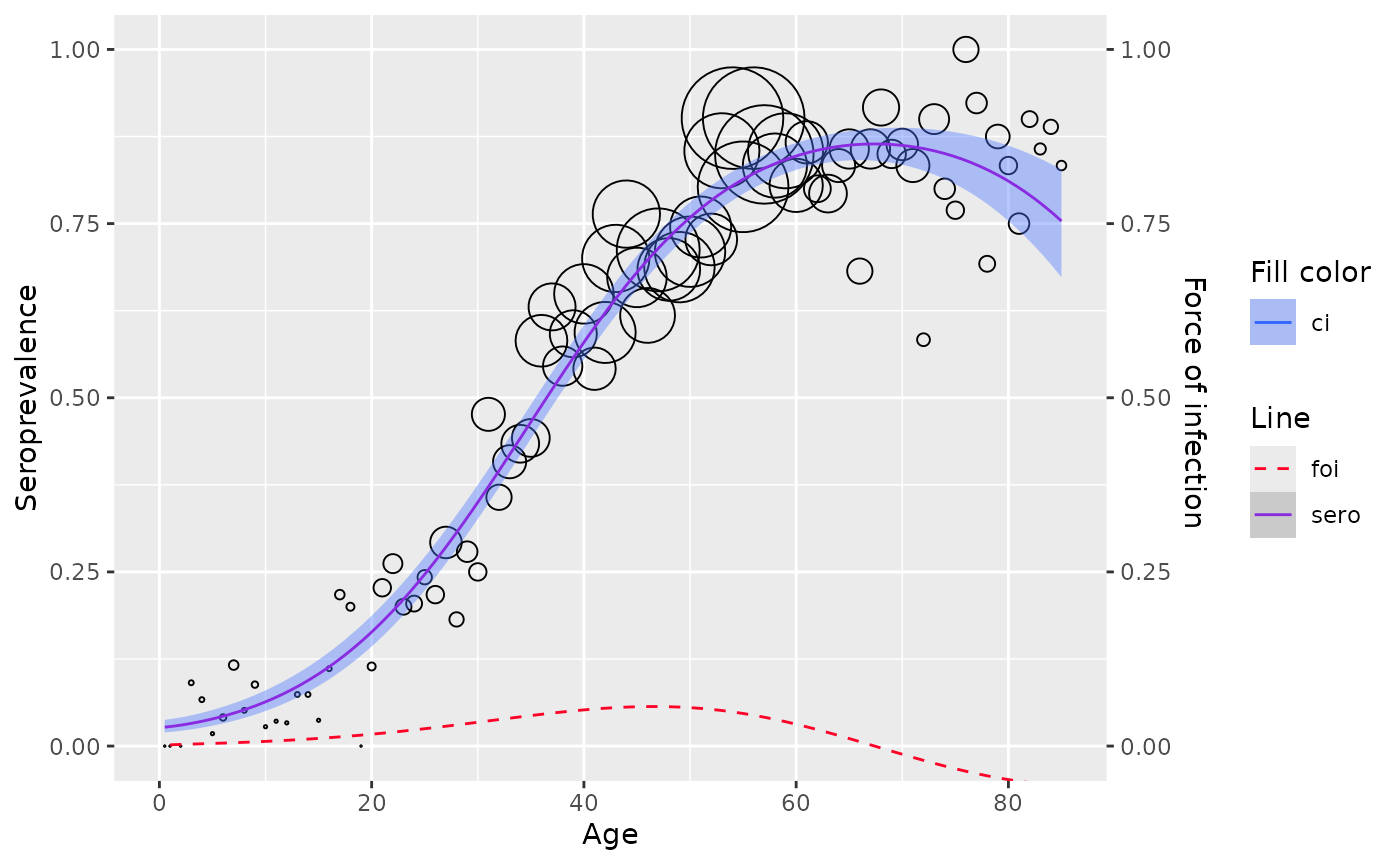
rubella <- rubella_uk_1986_1987

farrington_md <- farrington_model(
   rubella,
   start=list(alpha=0.07,beta=0.1,gamma=0.03)
   )
plot(farrington_md)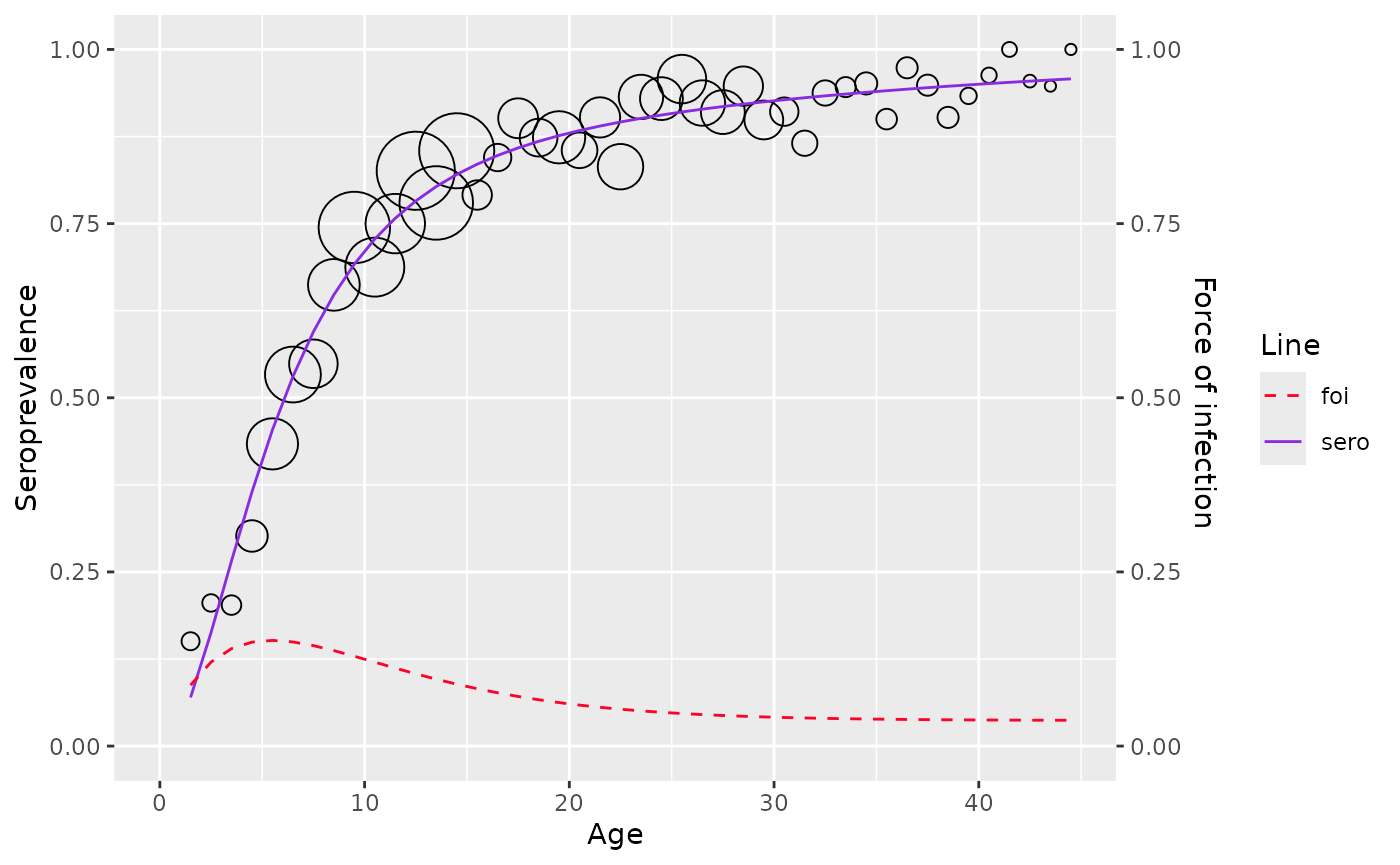
Customize the plot
Built-in function
serosv offers the function set_plot_style()
to customize some key attributes of the plot.
Current modifiable attributes include color, linetype for seroprevalence, foi and fill color for confidence interval
hav_mod <- polynomial_model(hav_bg_1964, k=3)

# customize plot
plot(hav_mod) +
  set_plot_style(
    sero = "#3de071",
    foi = "#2f22e0",
    ci = "#aaf2b2",
    foi_line = "dotted",
    sero_line = "dotdash"
  )
#> Scale for colour is already present.
#> Adding another scale for colour, which will replace the existing scale.
#> Scale for linetype is already present.
#> Adding another scale for linetype, which will replace the existing scale.
#> Scale for fill is already present.
#> Adding another scale for fill, which will replace the existing scale.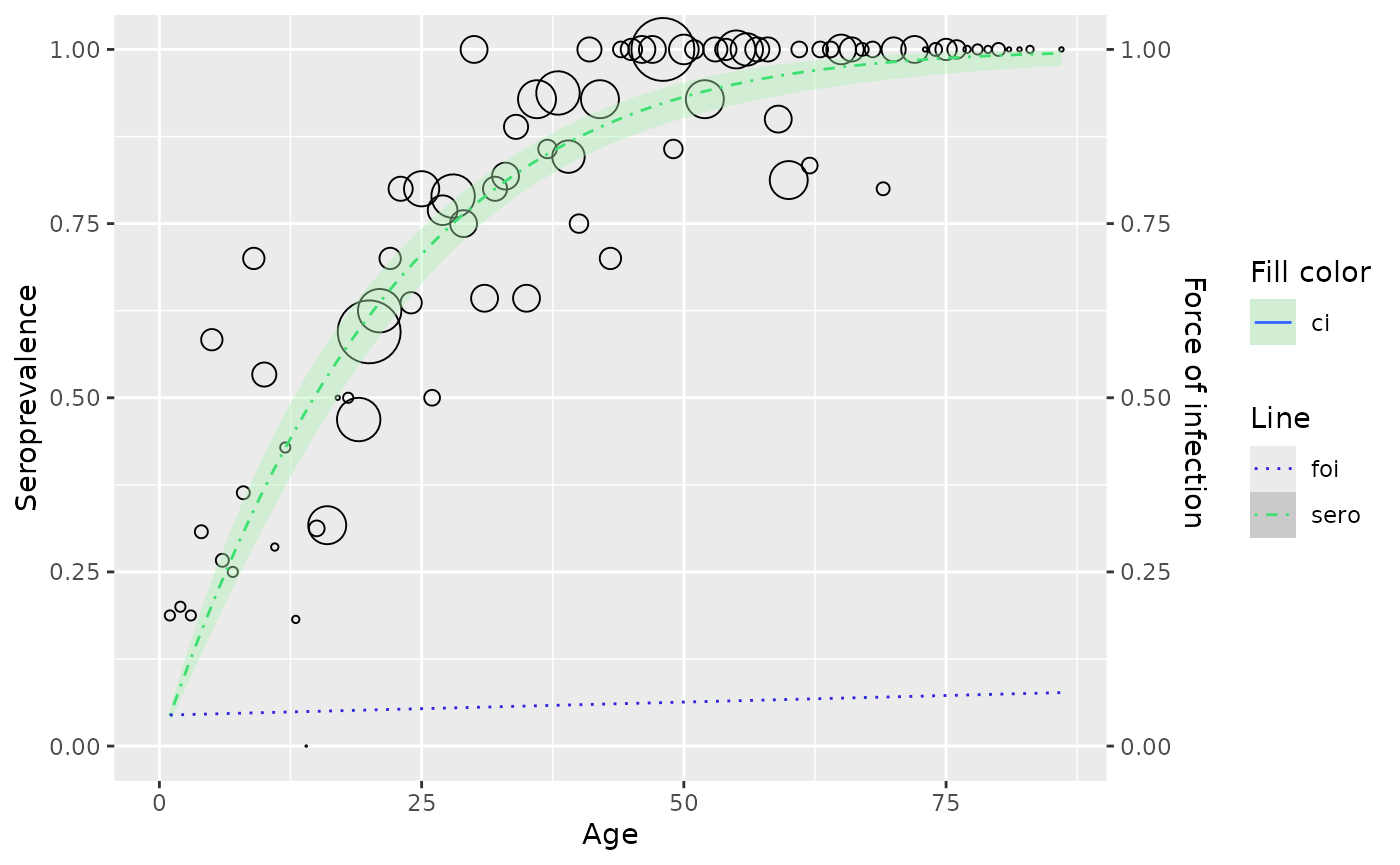
ggplot2 functions
Since serosv uses ggplot2 for plotting, the
returned plot is a gg object meaning any standard
ggplot2 layer can be appended with + for
further configurations.
Examples
library(ggplot2)

# Set x and y limits
plot(hav_mod) +
  coord_cartesian(xlim = c(0, 50), ylim = c(0, 1.5))
#> Coordinate system already present. Adding new coordinate system, which will
#> replace the existing one.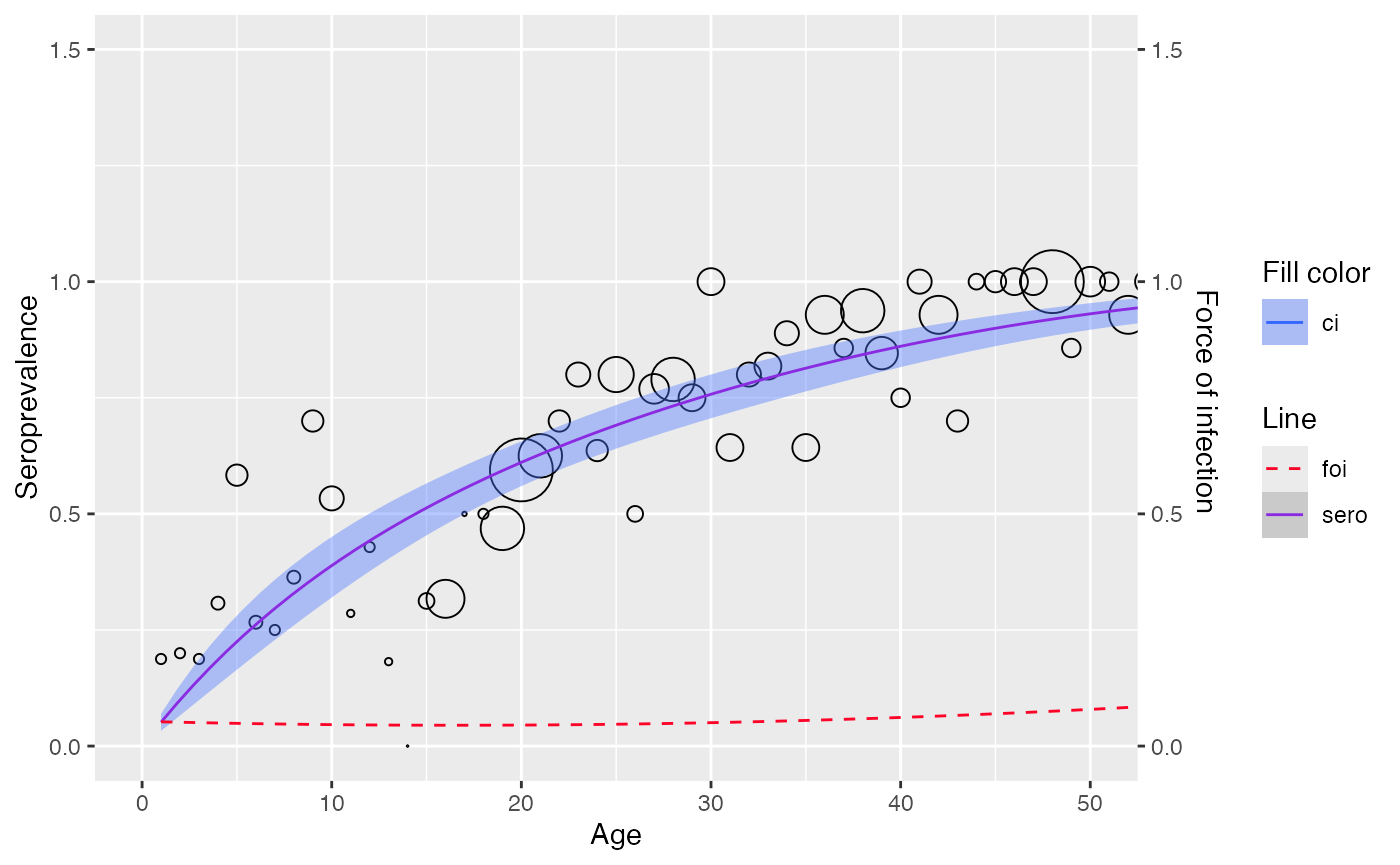
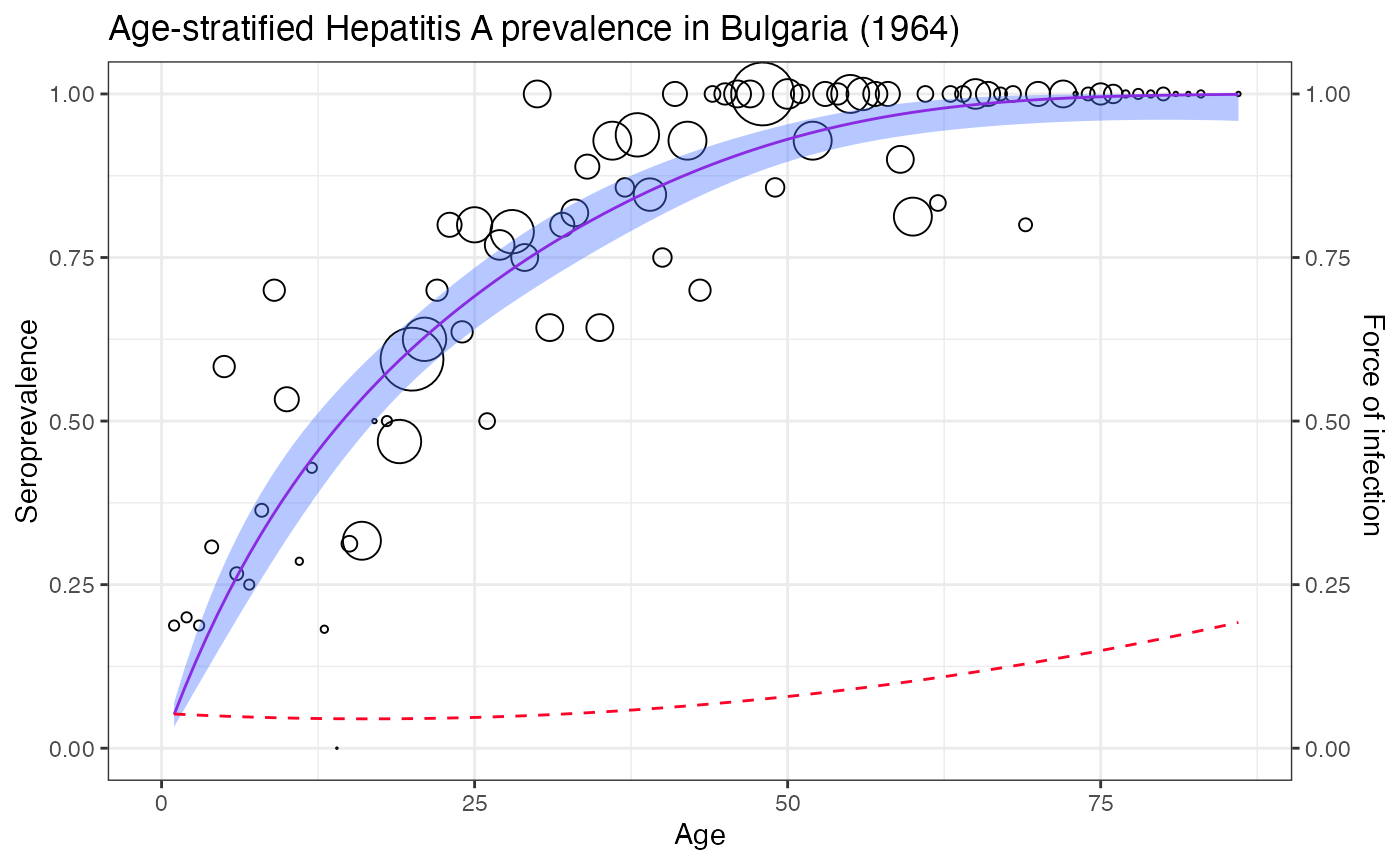
# Set titles and omit legends
plot(hav_mod) +
  theme_bw() +
  ggtitle("Age-stratified Hepatitis A prevalence in Bulgaria (1964)") +
  guides(
    colour = "none",
    linetype = "none",
    fill = "none"
  )