Fit age-stratified seroprevalence data to serocatalytic models formulated as polynomials.
Usage
polynomial_model(
  data,
  k,
  link = "log",
  age_col = "age",
  pos_col = "pos",
  tot_col = "tot",
  status_col = "status"
)
Arguments
- data
the input data frame, must either have columns for `age`, `pos`, `tot` (for aggregated data) OR `age`, `status` (for linelisting data)
- k
degree of the polynomial. (k=1 for Muench model, k=2 for Griffith model, k=3 for Grenfell model).
- link
link function (default link="log").
- age_col
name of the `age` column (default age_col="age").
- pos_col
name of the `pos` column (default pos_col="pos").
- tot_col
name of the `tot` column (default tot_col="tot").
- status_col
name of the `status` column (default status_col="status").
Value
a list of class polynomial_model with 5 items
- datatype
type of datatype used for model fitting (aggregated or linelisting)
- df
the dataframe used for fitting the model
- info
fitted "glm" object
- sp
seroprevalence
- foi
force of infection
Details
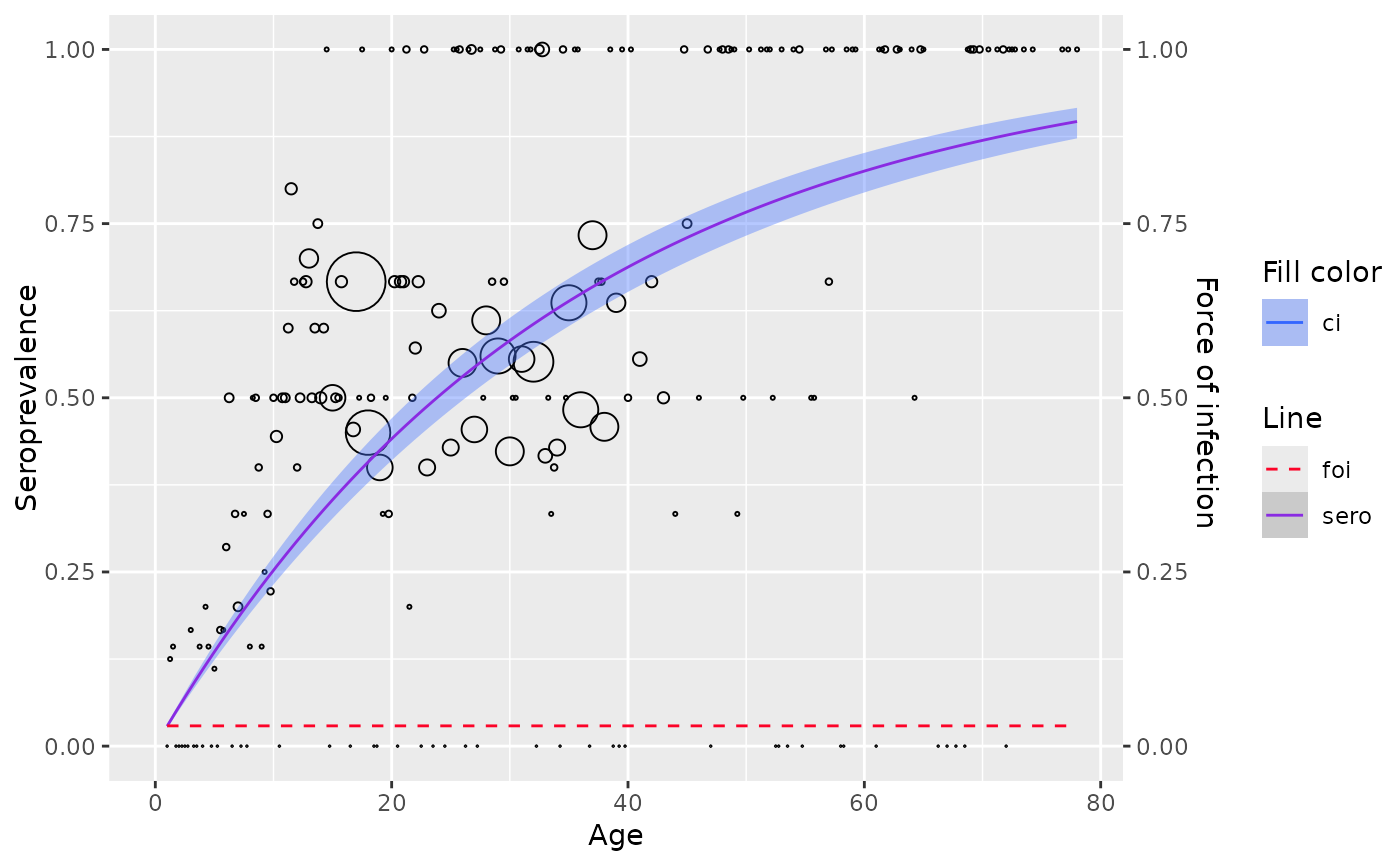
The seroprevalence is assumed to follow the general format $$ \pi(a) = 1 - e^{-\Sigma_{i=1}^k \beta_i a^i} $$ Which implies the force of infection to be \(\lambda(a) = \Sigma_{i=1}^k \beta_i i a^{i-1}\)
Where:
- \(\pi\) is the seroprevalence at age \(a\)
- \(a\) is the variable age
- \(k\) is the degree of the polynomial
The seroprevalence \(\pi(a)\) is fitted using a GLM with log link with the linear predictor \(\eta(a) = \Sigma_{i=1}^k \beta_i a^{i}\)
Muench (1934) model is equivalent to a degree 1 (\(k=1\)) linear predictor
Griffith model is equivalent to a degree 2 (\(k=2\)) linear predictor
Grenfell & Anderson (1985) suggested a higher order polynomials (\(k \geq 3\))
Refer to section 6.1.1. of the the book by Hens et al. (2012) for further details.
References
Hens, Niel, Ziv Shkedy, Marc Aerts, Christel Faes, Pierre Van Damme, and Philippe Beutels. 2012. Modeling Infectious Disease Parameters Based on Serological and Social Contact Data: A Modern Statistical Perspective. tatistics for Biology and Health. Springer New York. doi:10.1007/978-1-4614-4072-7 .
Grenfell, B. T., and R. M. Anderson. 1985. “The Estimation of Age-Related Rates of Infection from Case Notifications and Serological Data.” The Journal of Hygiene 95 (2): 419–36. doi:10.1017/s0022172400062859 .
Muench, Hugo. 1934. “Derivation of Rates from Summation Data by the Catalytic Curve.” Journal of the American Statistical Association 29 (185): 25–38. doi:10.1080/01621459.1934.10502684 .
Examples
data <- parvob19_fi_1997_1998[order(parvob19_fi_1997_1998$age), ]
aggregated <- transform_data(data, stratum_col = "age", status_col="seropositive")

# fit with aggregated data
model <- polynomial_model(aggregated, k = 1)
# fit with linelisting data
model <- polynomial_model(data,
    status_col = "seropositive",
    k = 1)
plot(model)